Fig. 19.
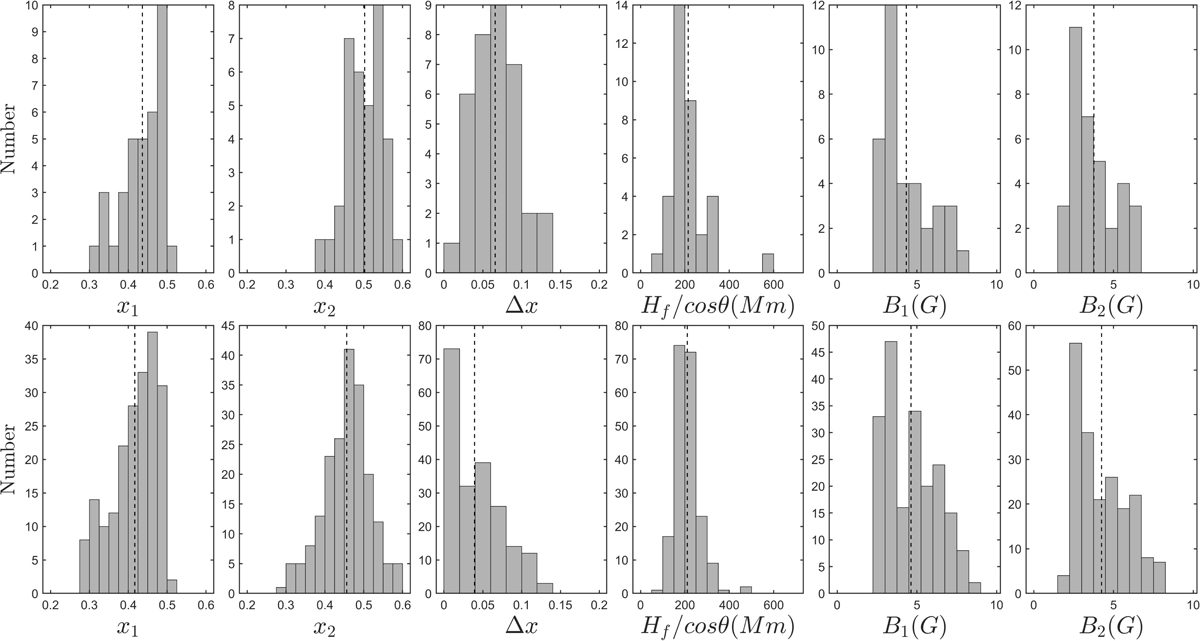
Histograms of fiber parameters derived from the least square fit of the drift rate of 38 outbound typical fiber groups (top) and the tracks of 209 individual fibers of the same class (bottom). x1, x2 are the start and end values of x, Δx their difference, Hf/cosθ the frequency scale length along the exciter trajectory, B1, B2 the magnetic field at the start and at the end of the fibers.
Current usage metrics show cumulative count of Article Views (full-text article views including HTML views, PDF and ePub downloads, according to the available data) and Abstracts Views on Vision4Press platform.
Data correspond to usage on the plateform after 2015. The current usage metrics is available 48-96 hours after online publication and is updated daily on week days.
Initial download of the metrics may take a while.