Fig. 18.
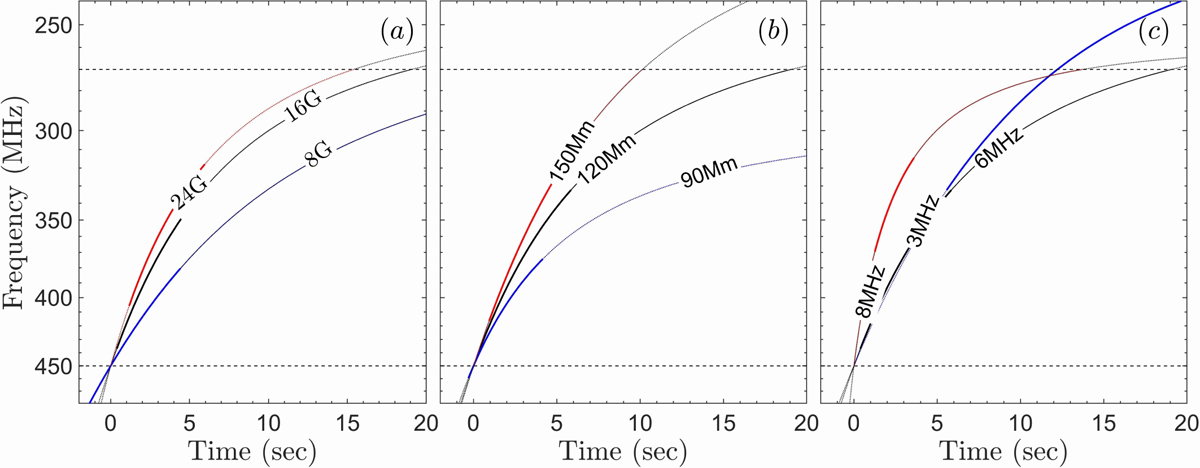
Model tracks of fiber busts on dynamic spectra. The basic model (black line in all plots) is for B0 = 16 G, r = 120 Mm, fw = 6 MHz, Bt = 2 G and a fourfold Newkirk density model. Left panel: effect of B0, which is 8 G for the blue line and 24 G for the red line, middle panel: effect of the loop radius, which is 90 Mm (blue line) and 150 Mm (red line) and right panel effect of fw, which is 3 MHz for the blue line and 8 MHz for the red. Thick lines denote the region for which 0.25 < x < 0.5. Horizontal dashed lines mark the limits of the SAO frequency range.
Current usage metrics show cumulative count of Article Views (full-text article views including HTML views, PDF and ePub downloads, according to the available data) and Abstracts Views on Vision4Press platform.
Data correspond to usage on the plateform after 2015. The current usage metrics is available 48-96 hours after online publication and is updated daily on week days.
Initial download of the metrics may take a while.