Fig. 16.
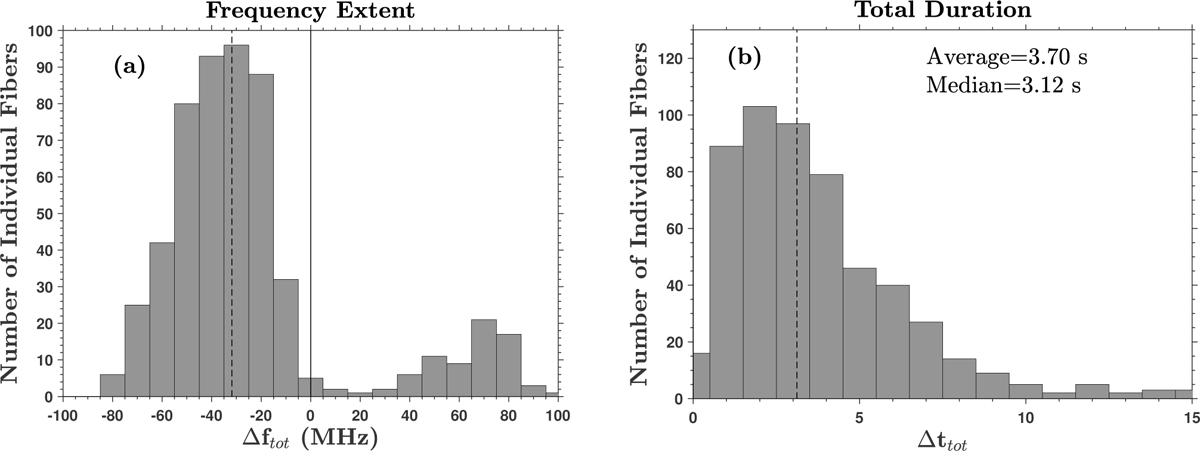
Distribution of characteristics of individual fibers (540 samples), measured directly from the dynamic spectra. Panel a: frequency range, Δf. The negative values of bandwidth are from outbound bursts. Panel b: total duration, Δttot. The histogram bin near zero in both panels corresponds to narrowband fibers, such as depicted in Fig. 13.
Current usage metrics show cumulative count of Article Views (full-text article views including HTML views, PDF and ePub downloads, according to the available data) and Abstracts Views on Vision4Press platform.
Data correspond to usage on the plateform after 2015. The current usage metrics is available 48-96 hours after online publication and is updated daily on week days.
Initial download of the metrics may take a while.