Fig. 15.
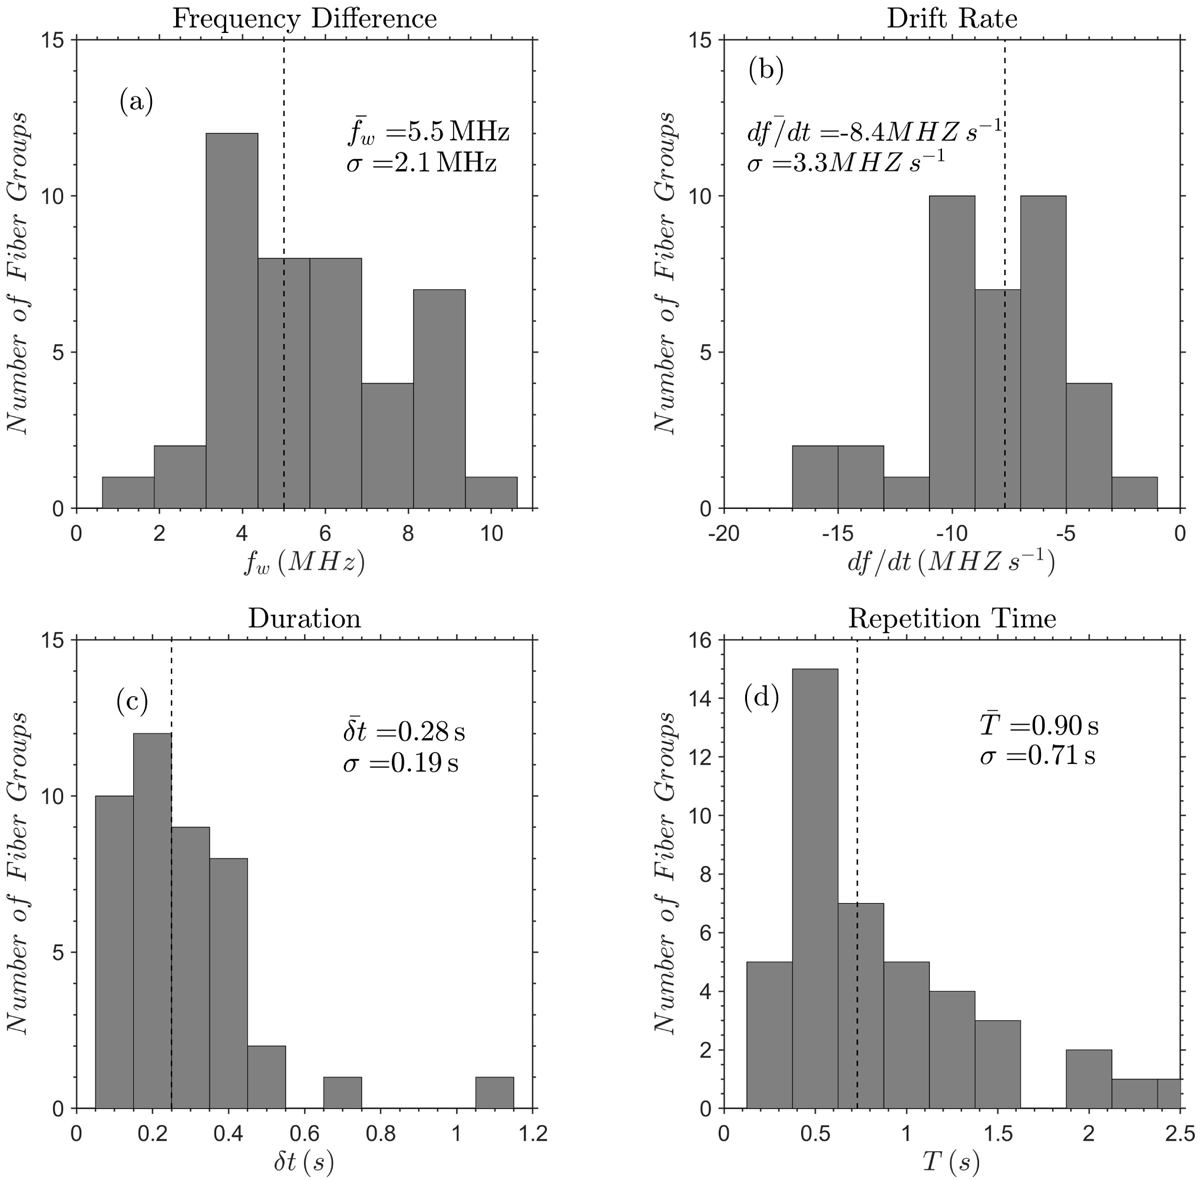
Distribution of fiber parameters computed by 2D autocorrelation. Panel a: frequency difference between absorption-emission peaks (see Fig. 2d). Panel b: frequency drift rate, calculated for the outbound typical fibers (groups 1−37). Panel c: duration at fixed frequency. Panel d: average repetition time. Both panels c and d were calculated at the central frequency for each group. In all panels except panel b data from groups 1−44 of Table A.1 were used, excluding narrowband fibers.
Current usage metrics show cumulative count of Article Views (full-text article views including HTML views, PDF and ePub downloads, according to the available data) and Abstracts Views on Vision4Press platform.
Data correspond to usage on the plateform after 2015. The current usage metrics is available 48-96 hours after online publication and is updated daily on week days.
Initial download of the metrics may take a while.