Free Access
Fig. 10.
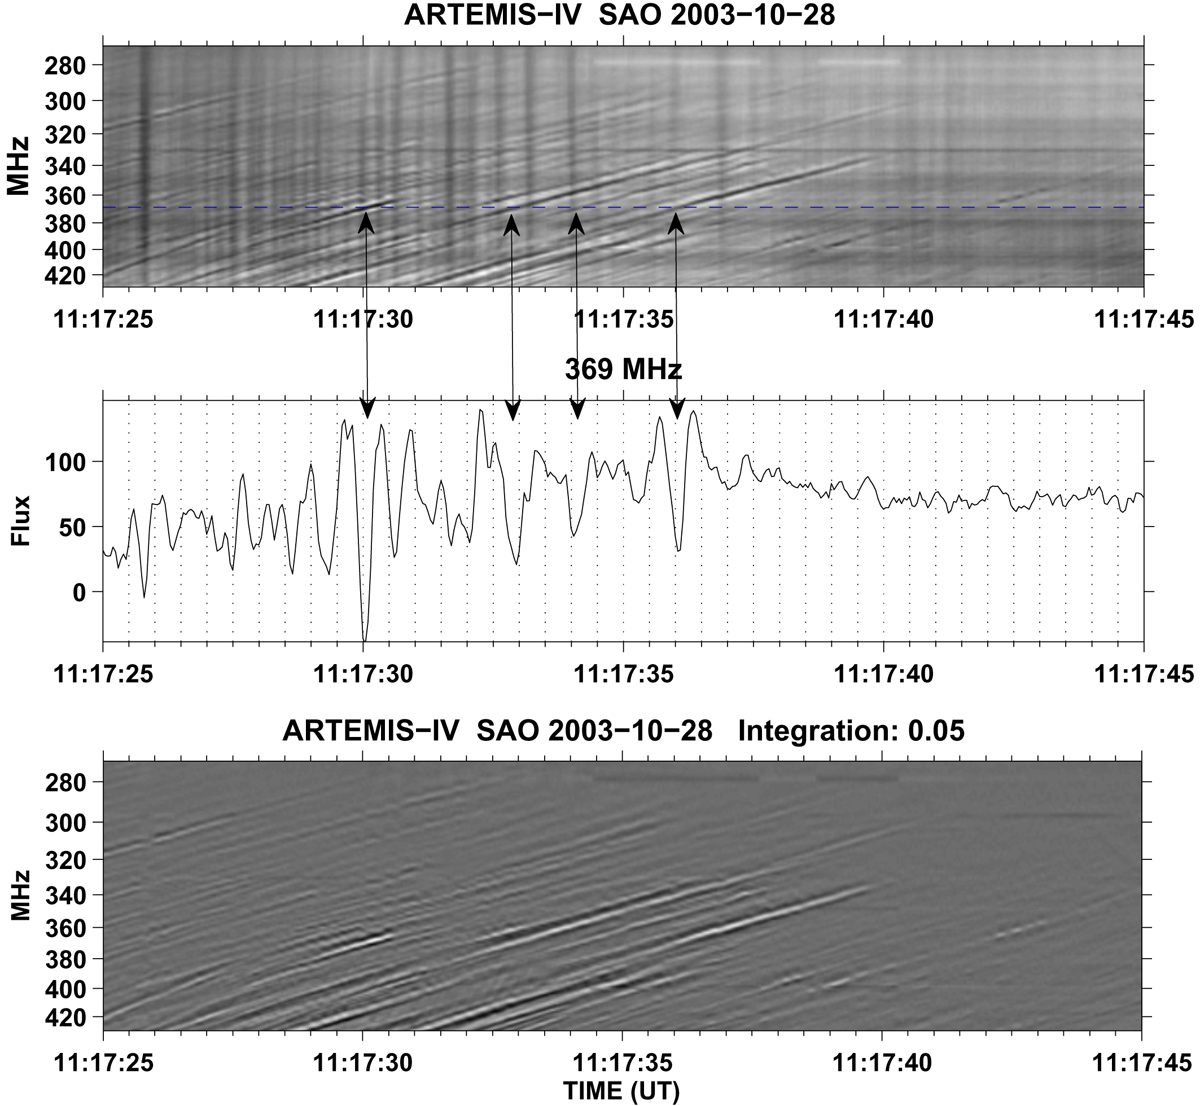
Fibers with an absorption ridge between two emission ridges. Top panel: dynamic spectrum (raw data). Middle panel: time intensity profile at the frequency indicated by the dashed line; arrows point to the absorption ridges. Bottom panel: filtered dynamic spectrum.
Current usage metrics show cumulative count of Article Views (full-text article views including HTML views, PDF and ePub downloads, according to the available data) and Abstracts Views on Vision4Press platform.
Data correspond to usage on the plateform after 2015. The current usage metrics is available 48-96 hours after online publication and is updated daily on week days.
Initial download of the metrics may take a while.