Fig. 1.
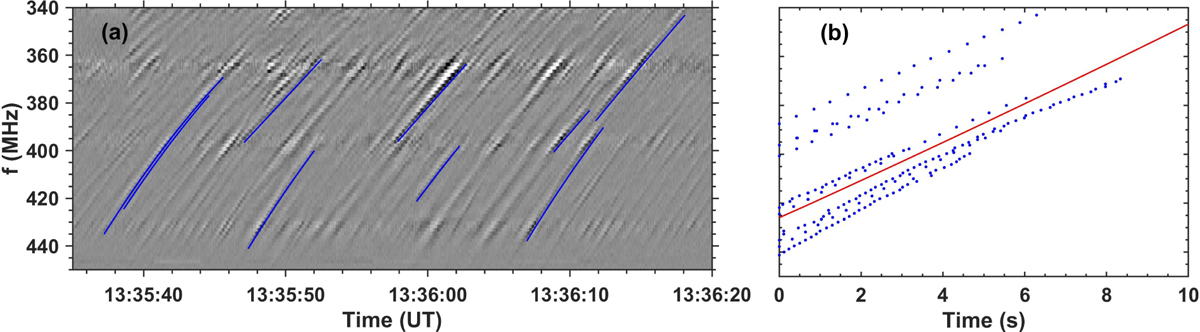
Tracking of individual fibers detected in the same group as in Fig. 3 (panel a). The same tracks are presented as a function of time difference from the beginning in panel b. The average track reconstructed from integration of the drift rate measured using cross-correlation is also plotted (red line). In this and subsequent figures the dynamic spectra are presented as negative images (darker parts corresponding to the higher intensities)
Current usage metrics show cumulative count of Article Views (full-text article views including HTML views, PDF and ePub downloads, according to the available data) and Abstracts Views on Vision4Press platform.
Data correspond to usage on the plateform after 2015. The current usage metrics is available 48-96 hours after online publication and is updated daily on week days.
Initial download of the metrics may take a while.