Fig. 9.
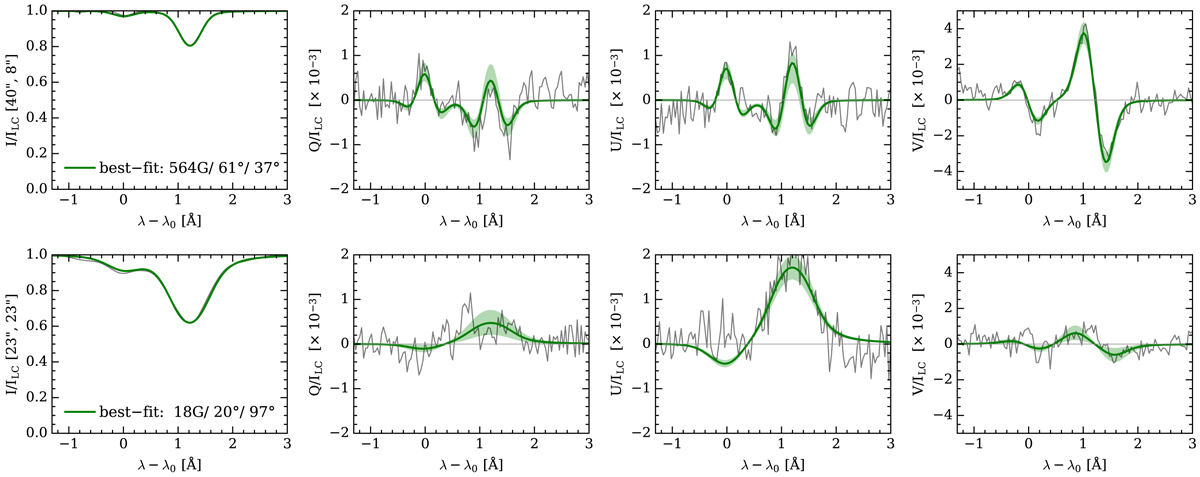
Observed (gray) and best-fitting (green) He I 10830 Å triplet profiles corresponding to a typical penumbral profile (upper row) and a filament profile (lower row). The coordinates of each pixel on the map are indicated in the y-label. A shadowed green area is displayed indicating the range of solutions compatible with the profiles obtained with the method described in Sect. 5. In the left panels the parameters of the best fit are displayed. The symbol ILC is the local continuum intensity.
Current usage metrics show cumulative count of Article Views (full-text article views including HTML views, PDF and ePub downloads, according to the available data) and Abstracts Views on Vision4Press platform.
Data correspond to usage on the plateform after 2015. The current usage metrics is available 48-96 hours after online publication and is updated daily on week days.
Initial download of the metrics may take a while.