Fig. 8.
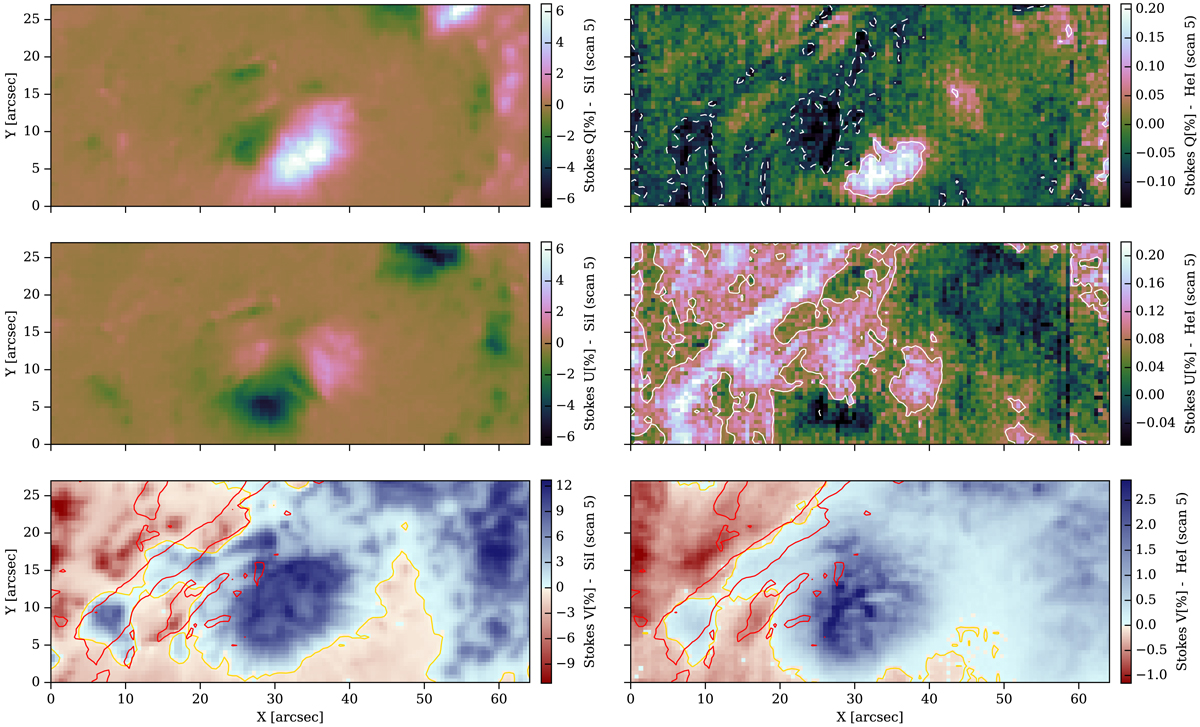
Stokes Q(λ0)/Ic, U(λ0)/Ic, and the amplitude of the red lobe (λR) of Stokes V(λR)/Ic for the Si I line at 10 827.1 Å (left column) and the red component of the He I triplet at 10 830.3 Å (right column). The white solid (dashed) contour shows the positive (negative) signals above three times the noise level. Red contours at 0.7Ic show where the filament is located.
Current usage metrics show cumulative count of Article Views (full-text article views including HTML views, PDF and ePub downloads, according to the available data) and Abstracts Views on Vision4Press platform.
Data correspond to usage on the plateform after 2015. The current usage metrics is available 48-96 hours after online publication and is updated daily on week days.
Initial download of the metrics may take a while.