Free Access
Fig. 6.
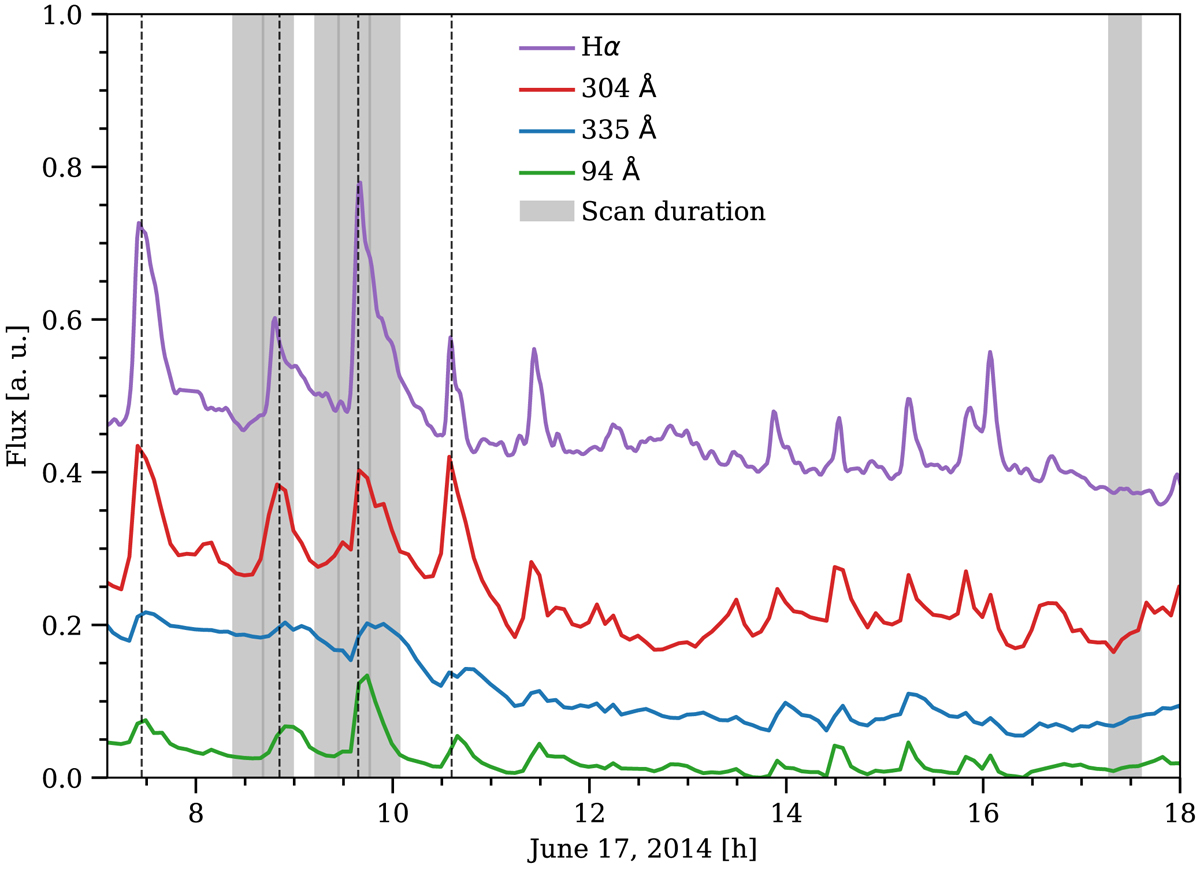
Time evolution of the flux (in arbitrary units) integrated over the active region area for some filters. The six gray areas define the intervals of each scan (∼15 min).
Current usage metrics show cumulative count of Article Views (full-text article views including HTML views, PDF and ePub downloads, according to the available data) and Abstracts Views on Vision4Press platform.
Data correspond to usage on the plateform after 2015. The current usage metrics is available 48-96 hours after online publication and is updated daily on week days.
Initial download of the metrics may take a while.