Free Access
Fig. 2.
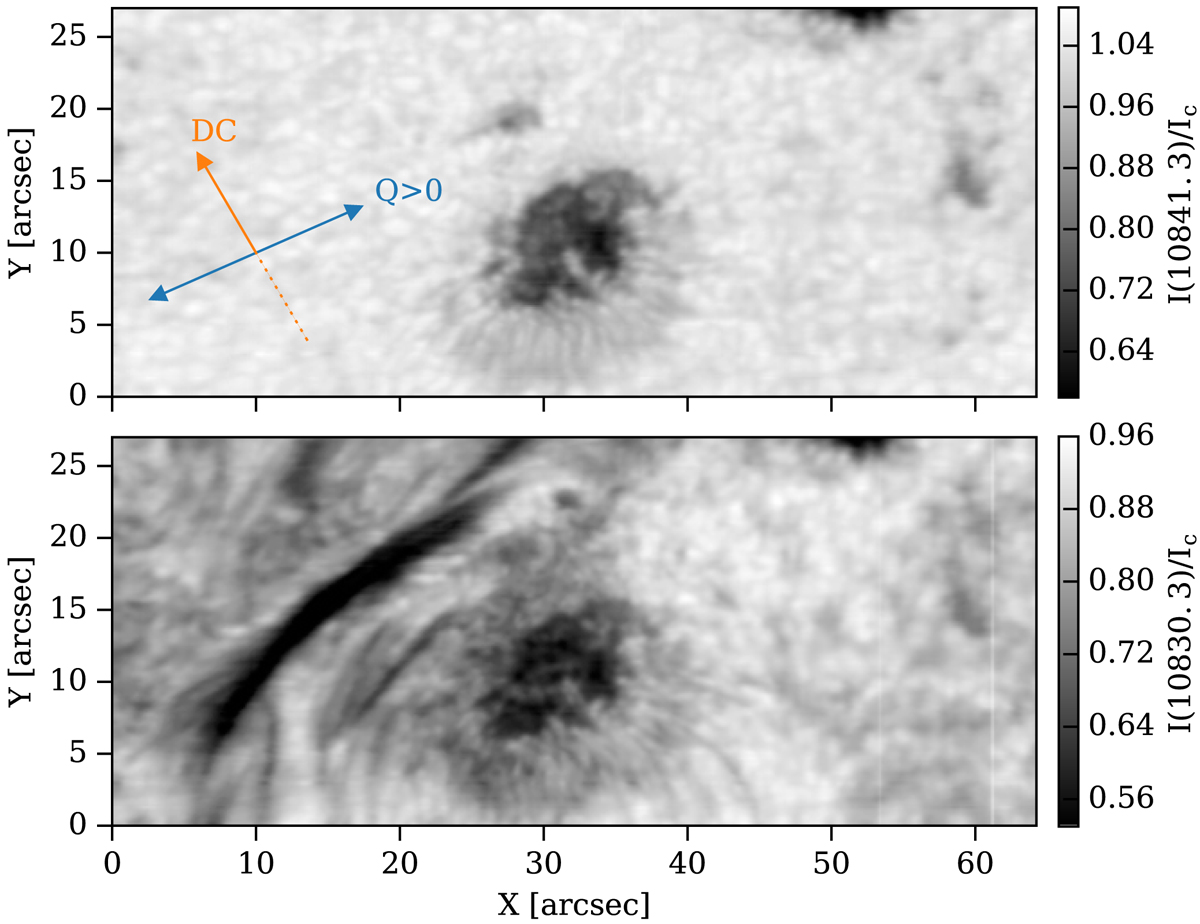
Reconstructed maps of the continuum map (top panel) and the He I 10 830 Å red core intensity (bottom panel) taken at 9:45 UT. The orange arrow indicates the direction toward the disk center (DC) and the blue arrow represents the reference of positive Stokes Q.
Current usage metrics show cumulative count of Article Views (full-text article views including HTML views, PDF and ePub downloads, according to the available data) and Abstracts Views on Vision4Press platform.
Data correspond to usage on the plateform after 2015. The current usage metrics is available 48-96 hours after online publication and is updated daily on week days.
Initial download of the metrics may take a while.