Fig. 12.
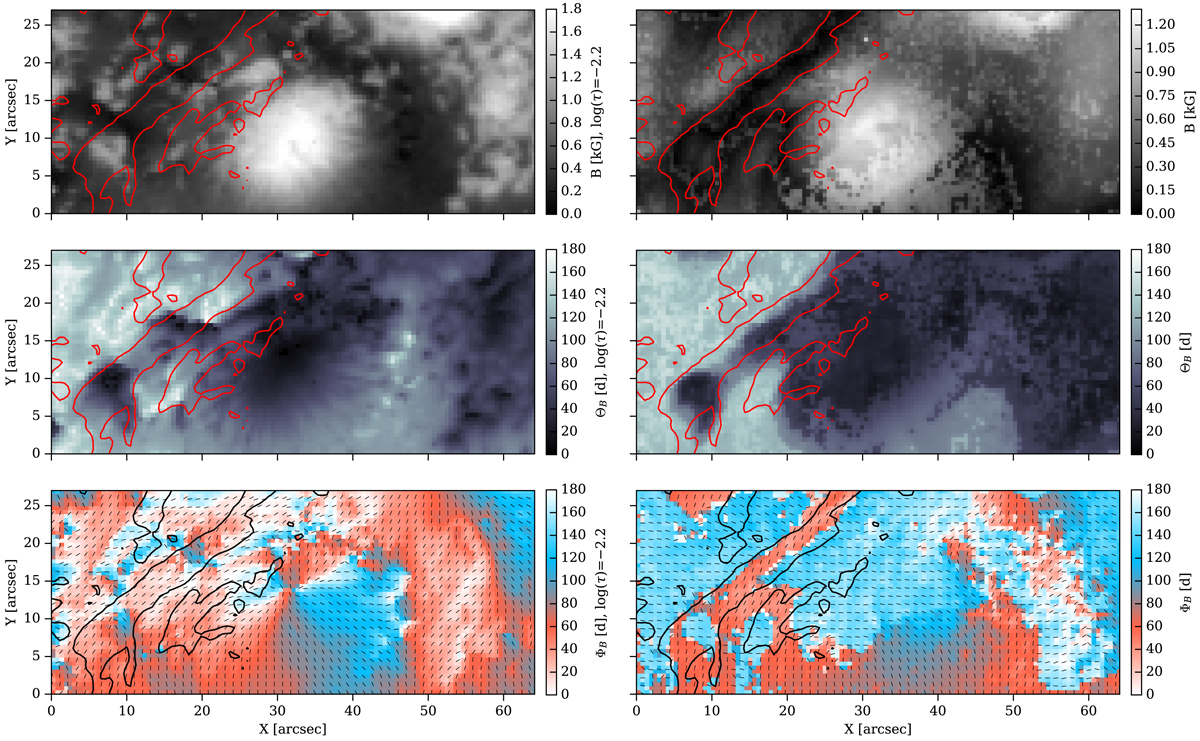
Magnetic field strength (top row), inclination (middle row), and azimuth maps (bottom row) inferred from the inversion of the two spectral lines in the LOS reference frame. The left column shows the SIR inversion of the Si I line, while the right column shows the HAZEL inversion of the He I multiplet. Contours include all the points with an intensity lower than 0.7Ic, delineating the location of the filament.
Current usage metrics show cumulative count of Article Views (full-text article views including HTML views, PDF and ePub downloads, according to the available data) and Abstracts Views on Vision4Press platform.
Data correspond to usage on the plateform after 2015. The current usage metrics is available 48-96 hours after online publication and is updated daily on week days.
Initial download of the metrics may take a while.