Free Access
Fig. 10.
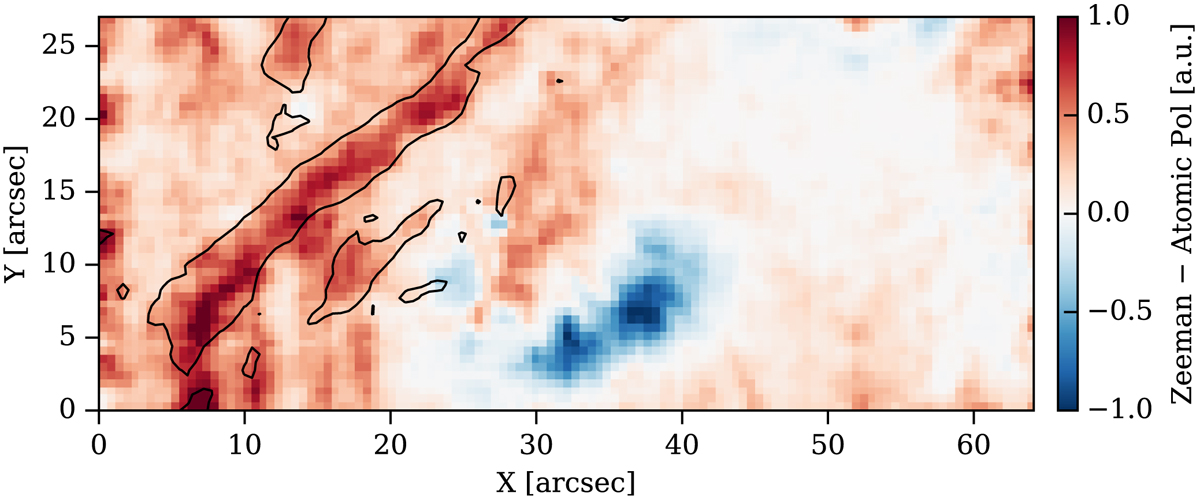
Classification of the Stokes Q and U profiles of the region. Zeeman-like profiles are drawn in blue and Hanle-like profiles in red. Polarization signals are color-coded by strength (white indicates low polarization signals where the shape is unclear). A contour at 0.7Ic is drawn to show the filament location.
Current usage metrics show cumulative count of Article Views (full-text article views including HTML views, PDF and ePub downloads, according to the available data) and Abstracts Views on Vision4Press platform.
Data correspond to usage on the plateform after 2015. The current usage metrics is available 48-96 hours after online publication and is updated daily on week days.
Initial download of the metrics may take a while.