Fig. 2.
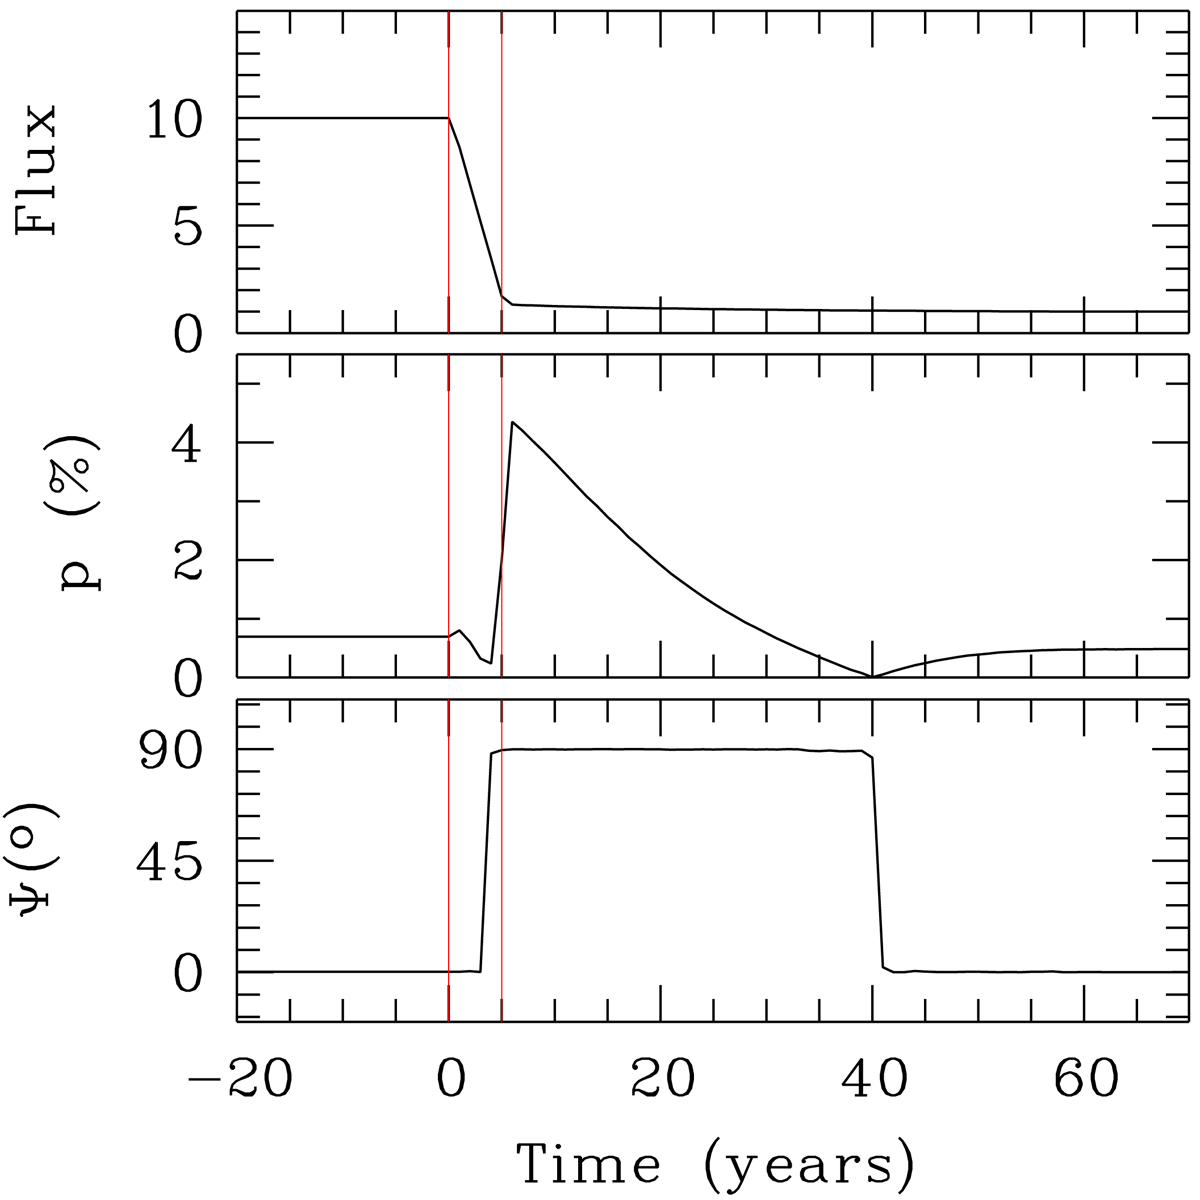
STOKES simulation of a type 1 quasar that suffers dimming of the continuum source by a factor of 10 in 5 years (indicated by the red vertical lines). Top: total flux in arbitrary units seen by the observer as a function of time. Middle: evolution of the polarization degree (p in percent). Bottom: evolution of the polarization position angle (Ψ in degrees).
Current usage metrics show cumulative count of Article Views (full-text article views including HTML views, PDF and ePub downloads, according to the available data) and Abstracts Views on Vision4Press platform.
Data correspond to usage on the plateform after 2015. The current usage metrics is available 48-96 hours after online publication and is updated daily on week days.
Initial download of the metrics may take a while.