Open Access
Fig. E.1.
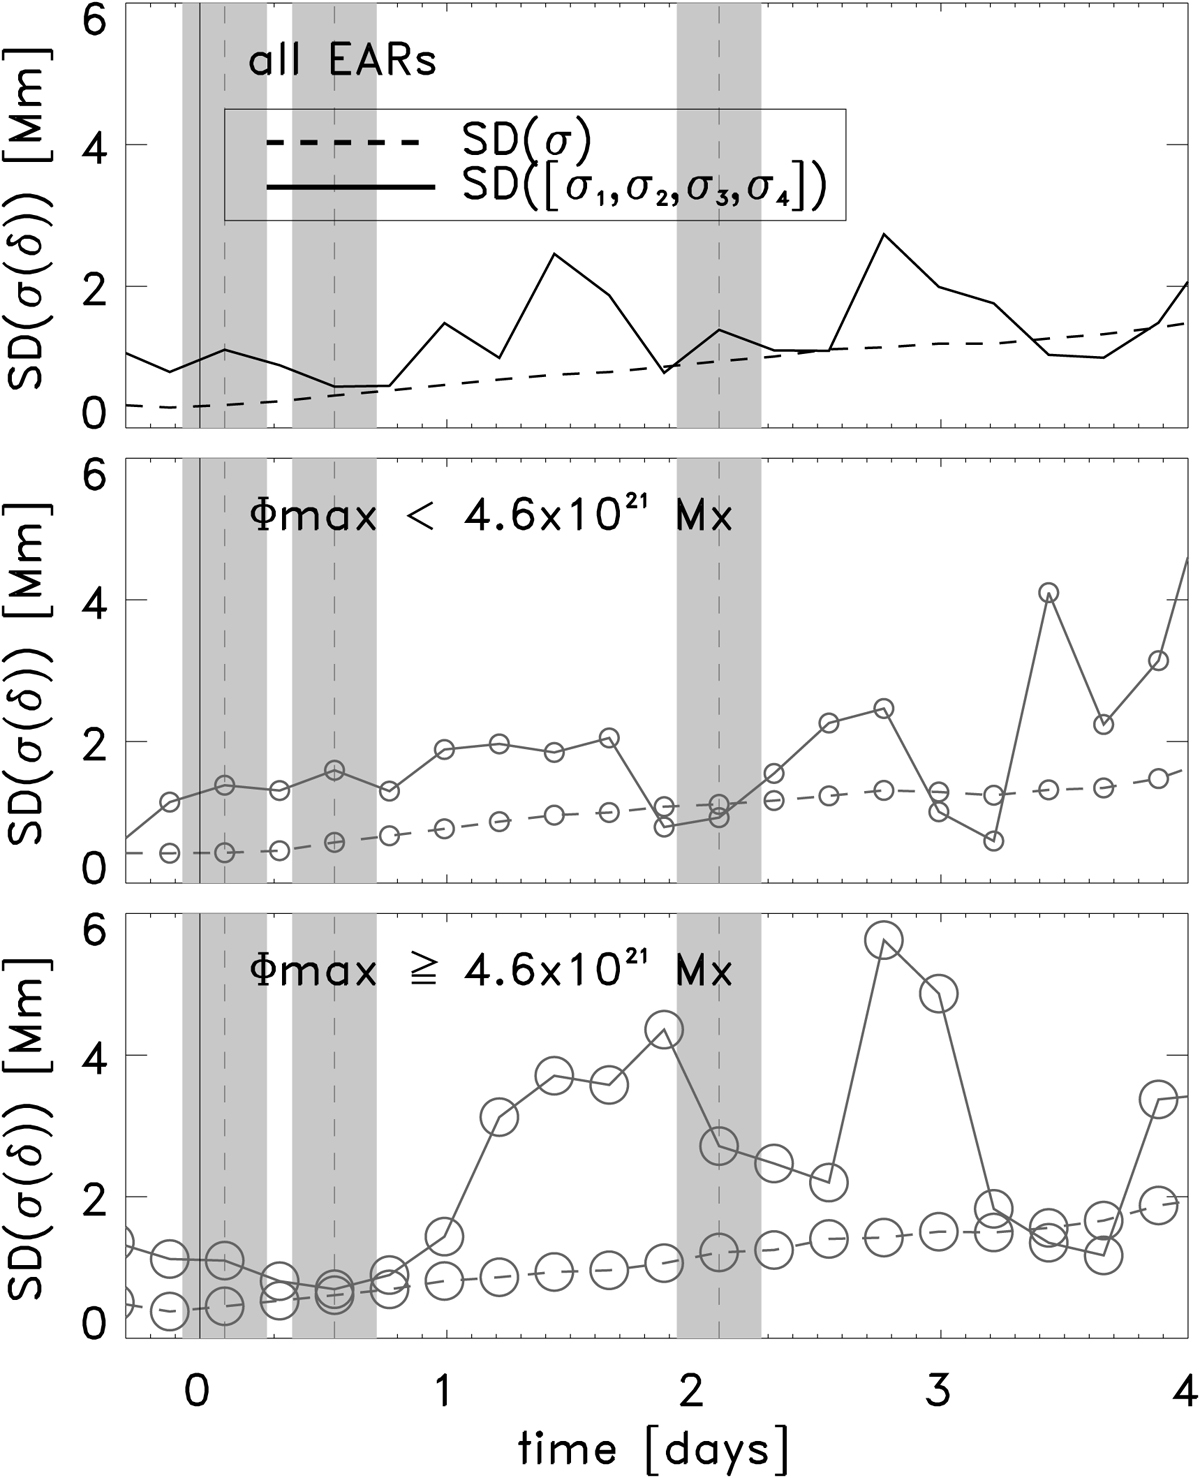
Standard deviation of the standard deviation of the separation between the polarities. Top panel: all EARs with valid position measurements at each time. Middle panel: same but for EARs with lower maximum flux than the median value. Bottom panel: EARs with higher maximum flux than the median value.
Current usage metrics show cumulative count of Article Views (full-text article views including HTML views, PDF and ePub downloads, according to the available data) and Abstracts Views on Vision4Press platform.
Data correspond to usage on the plateform after 2015. The current usage metrics is available 48-96 hours after online publication and is updated daily on week days.
Initial download of the metrics may take a while.