Fig. D.1.
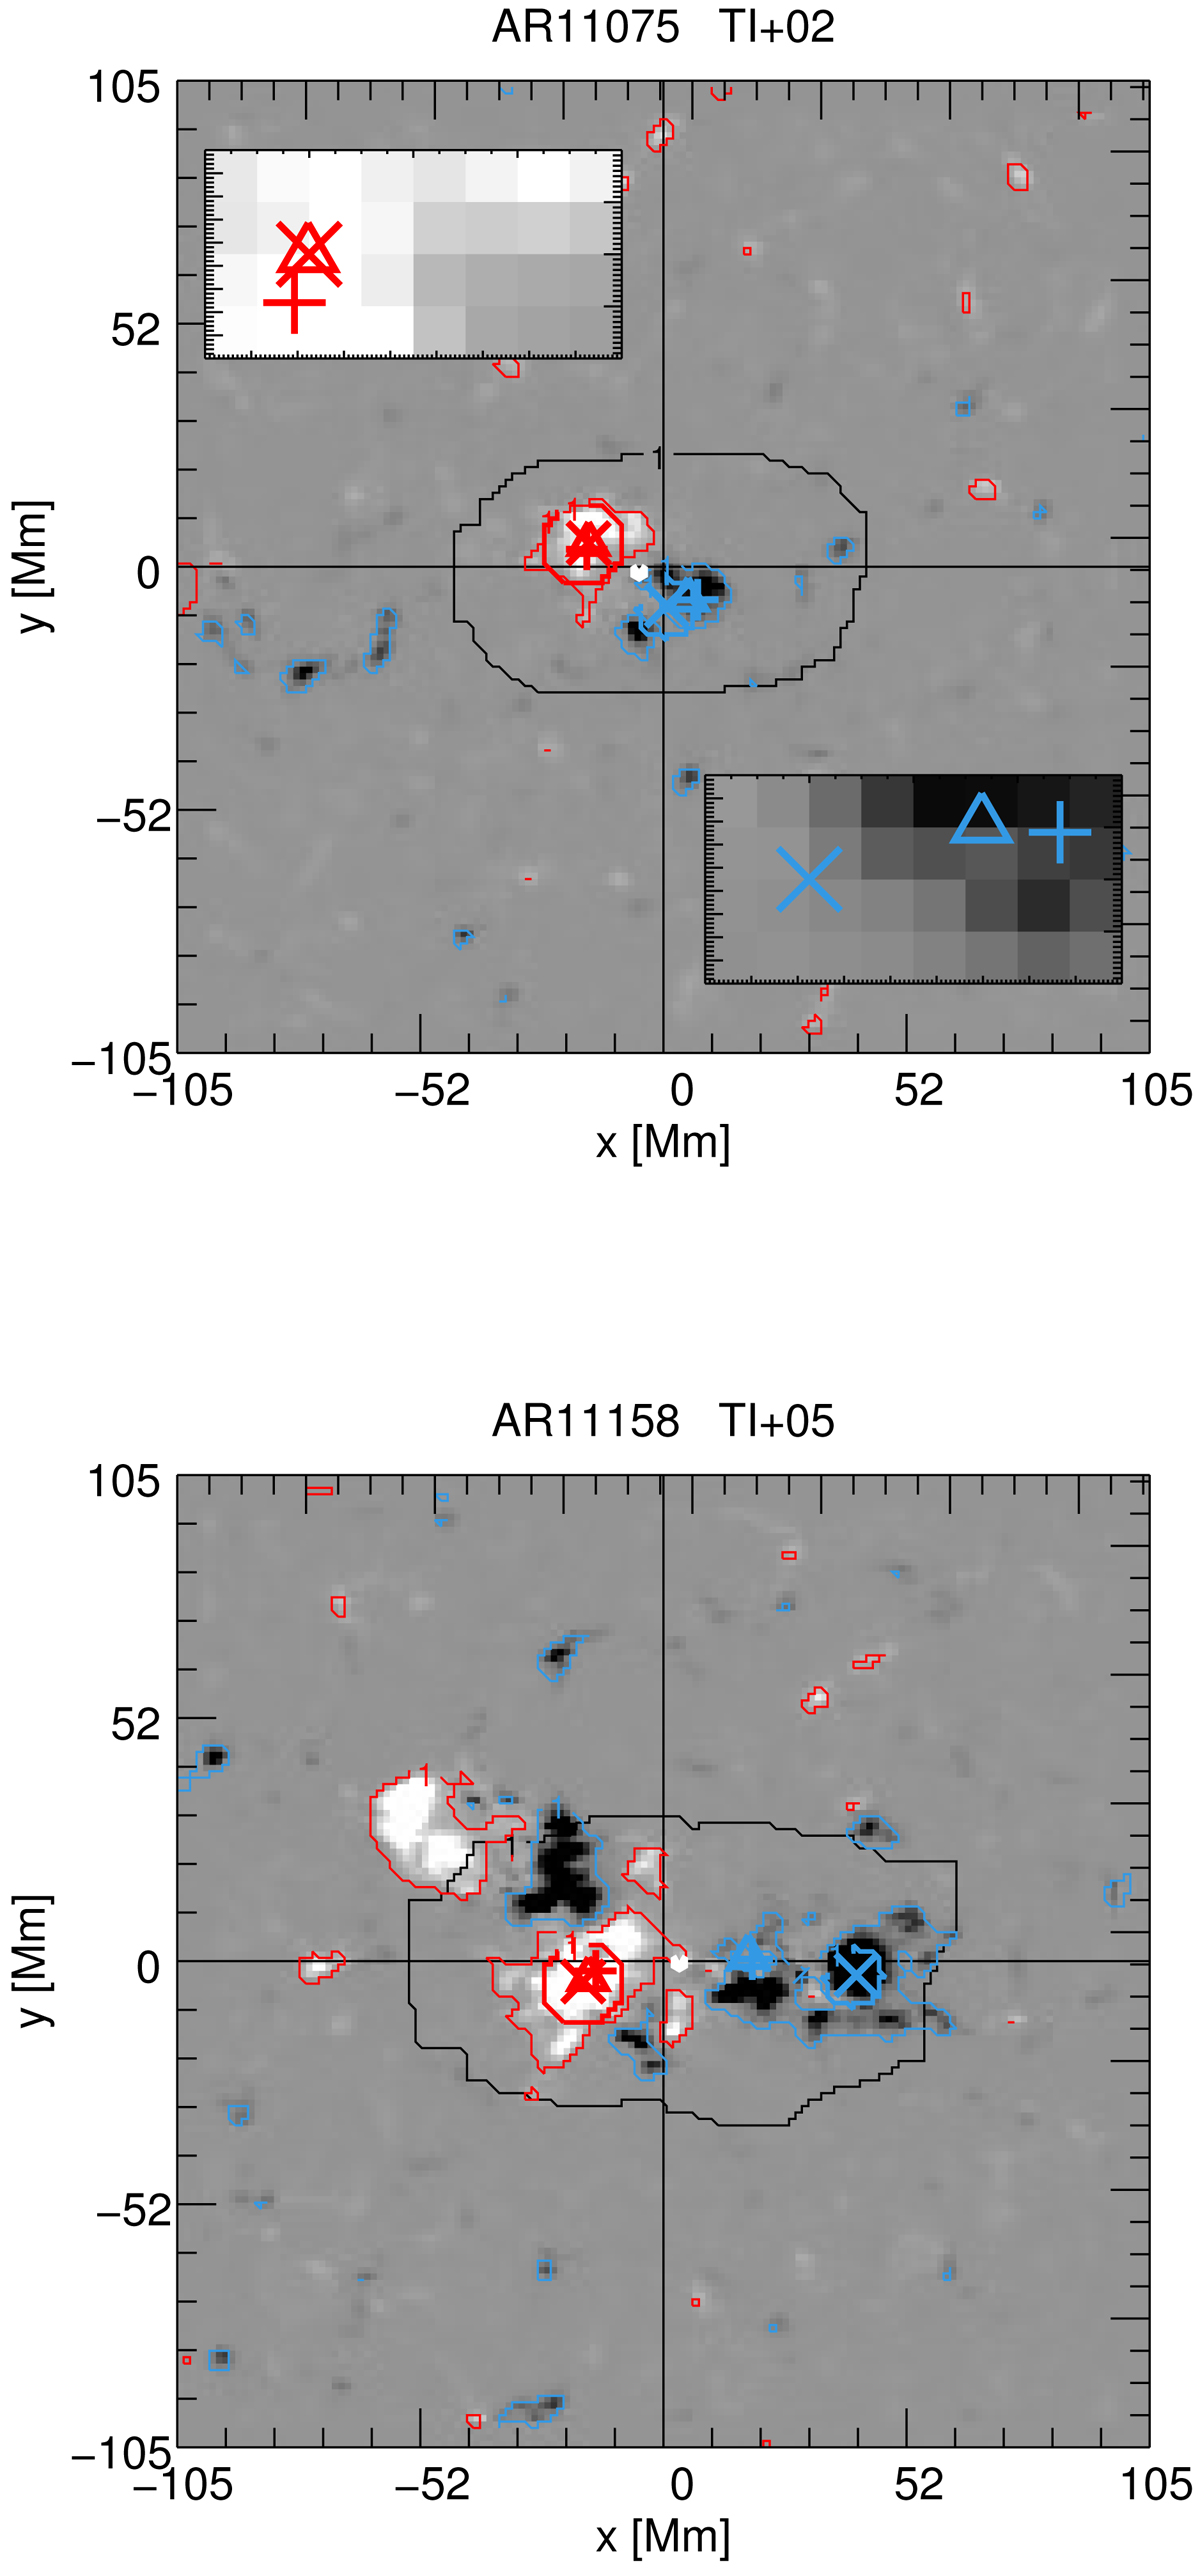
Detected locations of the positive (red) and negative (blue) polarity for two example line-of-sight magnetogram maps (grey-scale saturated at ±200 G), AR 11075 at TI+02 (top) and AR 11158 at TI+05 (bottom). The crosses indicate the positions detected by the nominal feature detection method. The triangle indicates the position detected by the flux weighted method. The plus signs indicate the positions detected by the flux summed method. The top has two insets which show the small differences in the positions more clearly, by up to a few pixels. The black contour encloses the search area for all methods. The red (blue) contour indicates all flux greater than +20 G (less than −20 G). See also Tables D.1 and D.2.
Current usage metrics show cumulative count of Article Views (full-text article views including HTML views, PDF and ePub downloads, according to the available data) and Abstracts Views on Vision4Press platform.
Data correspond to usage on the plateform after 2015. The current usage metrics is available 48-96 hours after online publication and is updated daily on week days.
Initial download of the metrics may take a while.