Fig. 6.
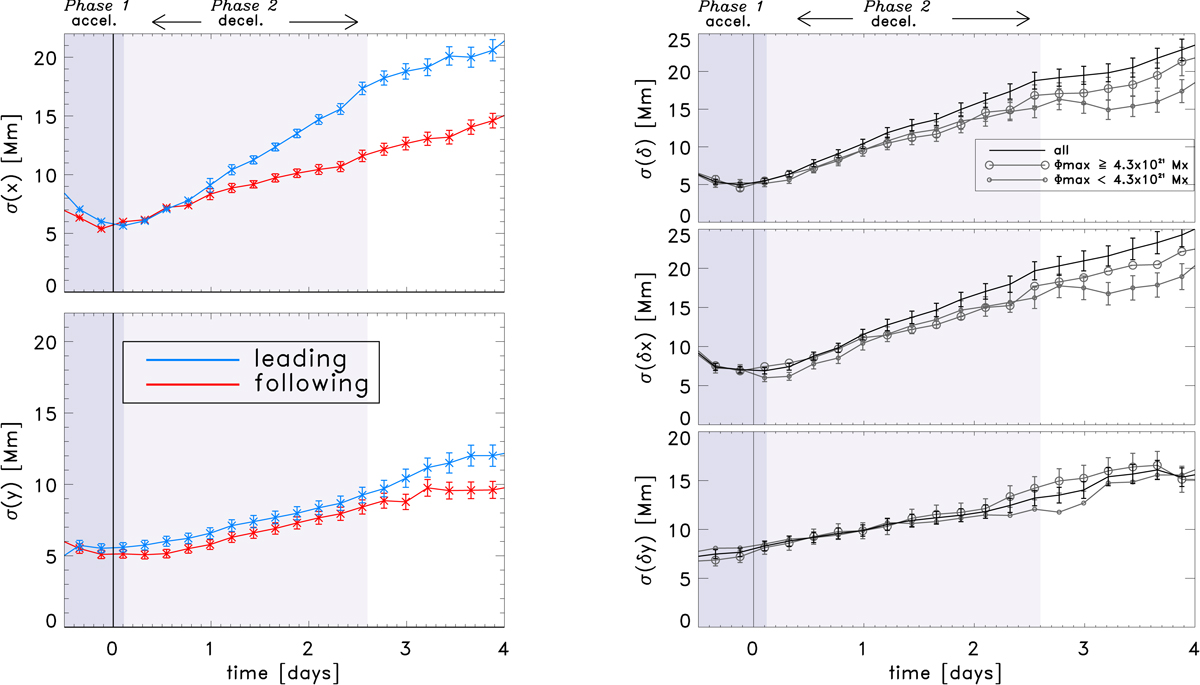
Left: standard deviation in the position of the leading (blue) and following (red) polarity position as a function of time. The error bars are the standard deviation of the sample standard deviation at each time interval as described by Eq. (E.1). To explain the difference in scatter, we suggest that the following polarity has less scatter because it is more diffuse than the leading polarity and the centre of gravity is not as affected by the buffeting from supergranules. Right: standard deviation of the separation, x-separation and y-separation of the polarities (from top to bottom panels) as a function of time for all EARs (black), EARs with a higher (lower) maximum flux than the median in large (small) grey circles. The EARs are divided into high and low maximum flux by the median value, 4.6 × 10²¹ Mx. The standard deviation of the sample standard deviation at each time interval is given by Eq. (E.1). The uncertainty in the separation of the polarities is largely independent of flux, and on the scale of supergranulation, which suggests that the scatter is not dependent on magnetic tension, but buffeting by supergranulation. The shaded regions indicate two different phases of emergence, an increasing separation speed between the polarities followed by a decreasing separation speed, defined in Fig. 4 and Sect. 6.
Current usage metrics show cumulative count of Article Views (full-text article views including HTML views, PDF and ePub downloads, according to the available data) and Abstracts Views on Vision4Press platform.
Data correspond to usage on the plateform after 2015. The current usage metrics is available 48-96 hours after online publication and is updated daily on week days.
Initial download of the metrics may take a while.