Fig. 3.
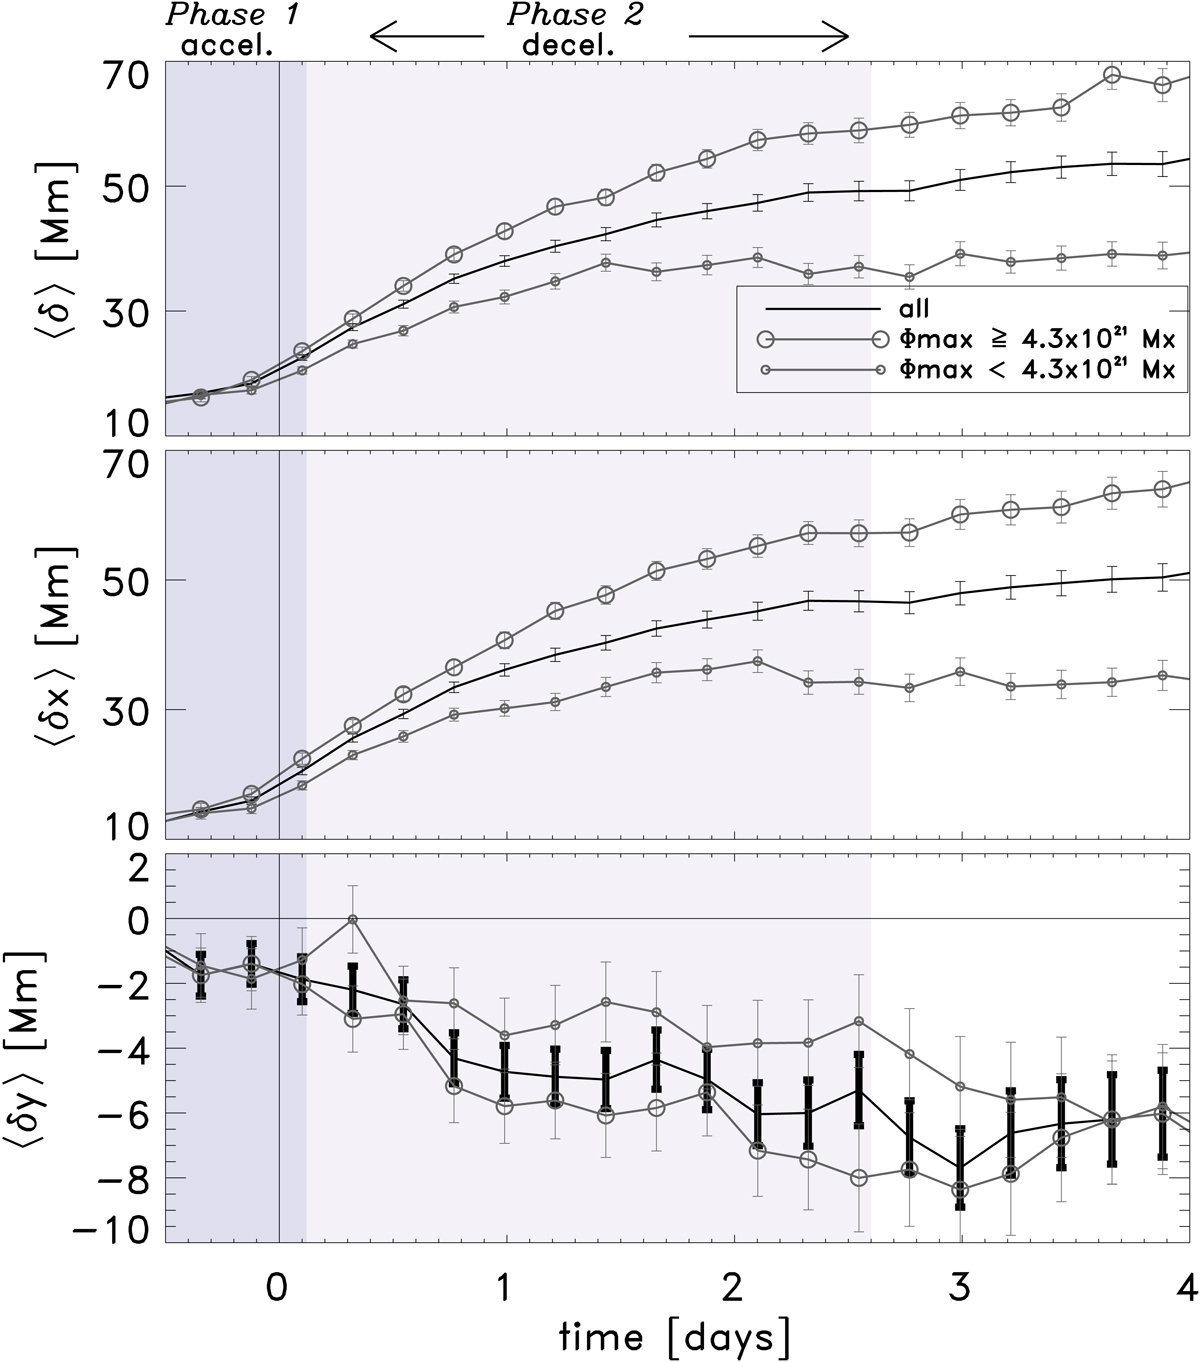
Mean separation (top), x-separation (middle), and y-separation (bottom) as functions of time for all regions (black) and regions with a higher (lower) maximum flux than the median in large (small) grey circles. The active regions are divided into high and low maximum flux by the median value, 4.6 × 10²¹ Mx. We note that the uncertainties depend on time. Higher flux regions have a larger separation in the east-west direction at the time of emergence and this becomes more pronounced with time. The shaded regions indicate two different phases of emergence, an increasing separation speed between the polarities, peaking at a value of 229 ± 11 ms−1, followed by a decreasing separation speed (see Fig. 4 and Sect. 6).
Current usage metrics show cumulative count of Article Views (full-text article views including HTML views, PDF and ePub downloads, according to the available data) and Abstracts Views on Vision4Press platform.
Data correspond to usage on the plateform after 2015. The current usage metrics is available 48-96 hours after online publication and is updated daily on week days.
Initial download of the metrics may take a while.