Fig. 1.
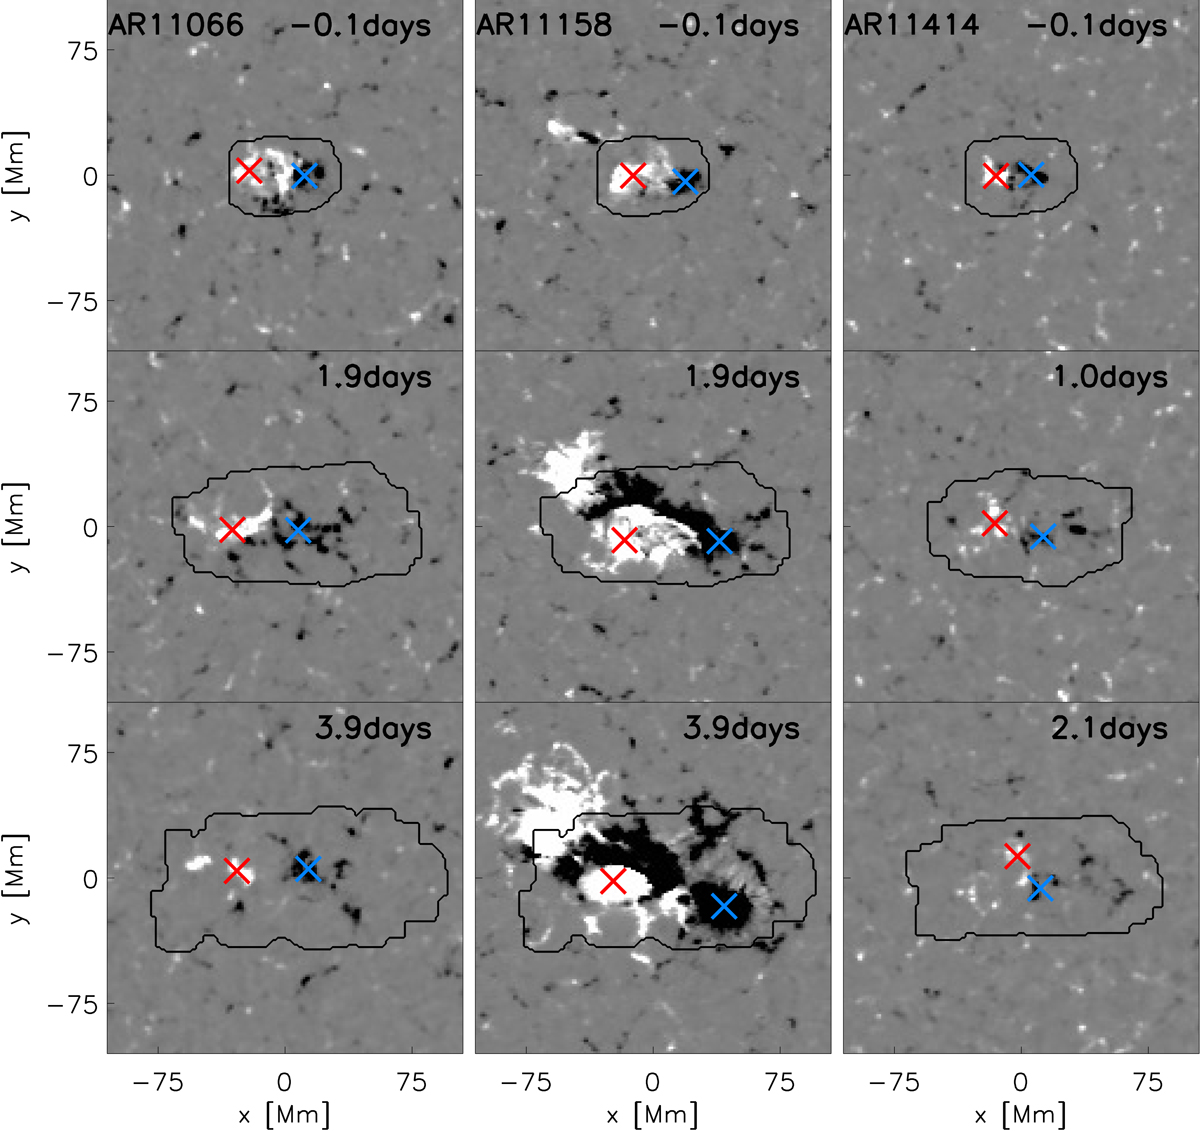
Position of negative (blue cross) and positive (red cross) polarities on the time-averaged line-of-sight magnetogram for a low-flux active region on the left (AR 11066), a complex, high-flux region in the middle (AR 11158), and a weak short-lived active region (AR 11414) on the right at different times. The range of the grey-scale is ±100 G. The black contour indicates the region within which we search for the polarities. AR 11414 is an example of an active region that was excluded from the analysis in this paper because it is not clear which feature should be defined as the leading polarity. For a full list of excluded regions, see Appendix C.
Current usage metrics show cumulative count of Article Views (full-text article views including HTML views, PDF and ePub downloads, according to the available data) and Abstracts Views on Vision4Press platform.
Data correspond to usage on the plateform after 2015. The current usage metrics is available 48-96 hours after online publication and is updated daily on week days.
Initial download of the metrics may take a while.