Fig. 12.
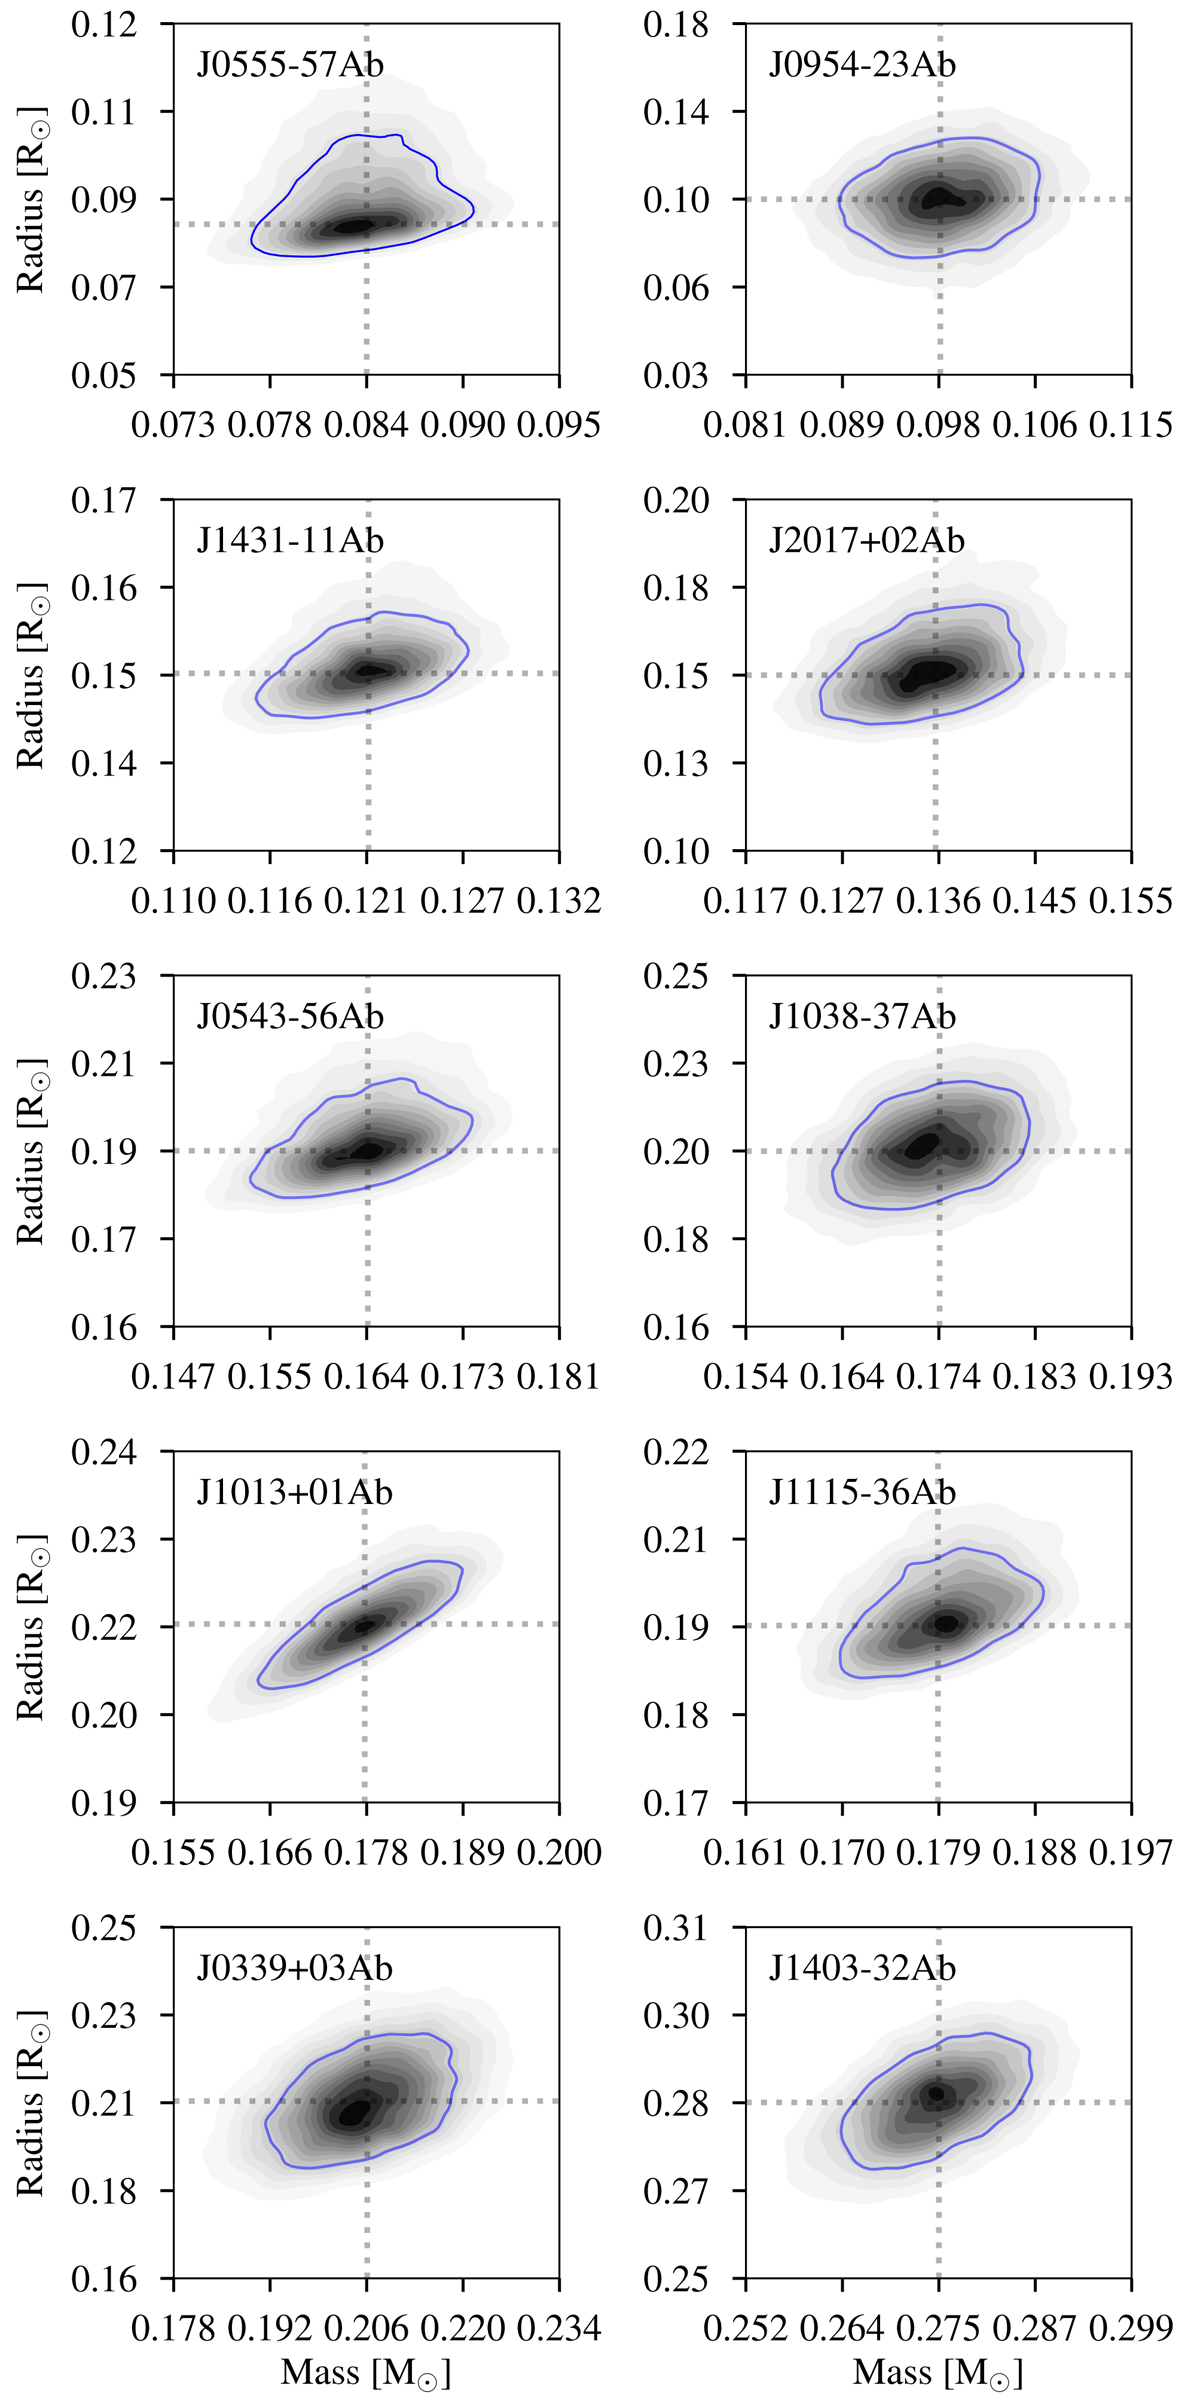
Mass-radius posterior distributions generated by the Markov chain Monte Carlo sampling. Visualised using kernel-density estimates. The 68%-level contour is shown in blue. Modal values are indicated by dotted lines. The mass and radius posterior distributions are correlated, since the primary star mass estimate is used in the derivation of both parameters.
Current usage metrics show cumulative count of Article Views (full-text article views including HTML views, PDF and ePub downloads, according to the available data) and Abstracts Views on Vision4Press platform.
Data correspond to usage on the plateform after 2015. The current usage metrics is available 48-96 hours after online publication and is updated daily on week days.
Initial download of the metrics may take a while.