Fig. 5
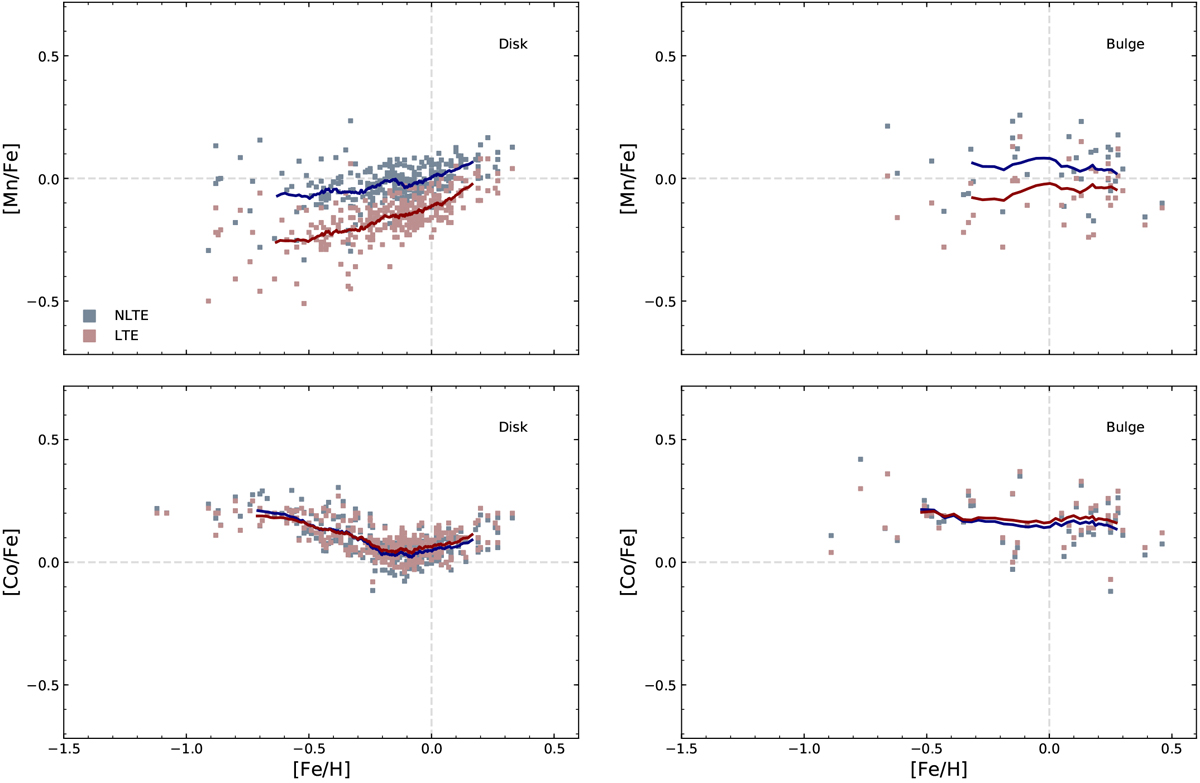
Abundances of Mn and Co calculated for the LTE (pink) and NLTE (blue) cases in the disk (left panels; the thin and thick disks combined) and bulge (right panels). The solid lines represent the running means (LTE: red, NLTE: dark blue). The LTE/NLTE running mean of the bulge sample was calculated regardless of the S/N; therefore, the LTE running means are different from the values in Fig. 4.
Current usage metrics show cumulative count of Article Views (full-text article views including HTML views, PDF and ePub downloads, according to the available data) and Abstracts Views on Vision4Press platform.
Data correspond to usage on the plateform after 2015. The current usage metrics is available 48-96 hours after online publication and is updated daily on week days.
Initial download of the metrics may take a while.