Fig. 4
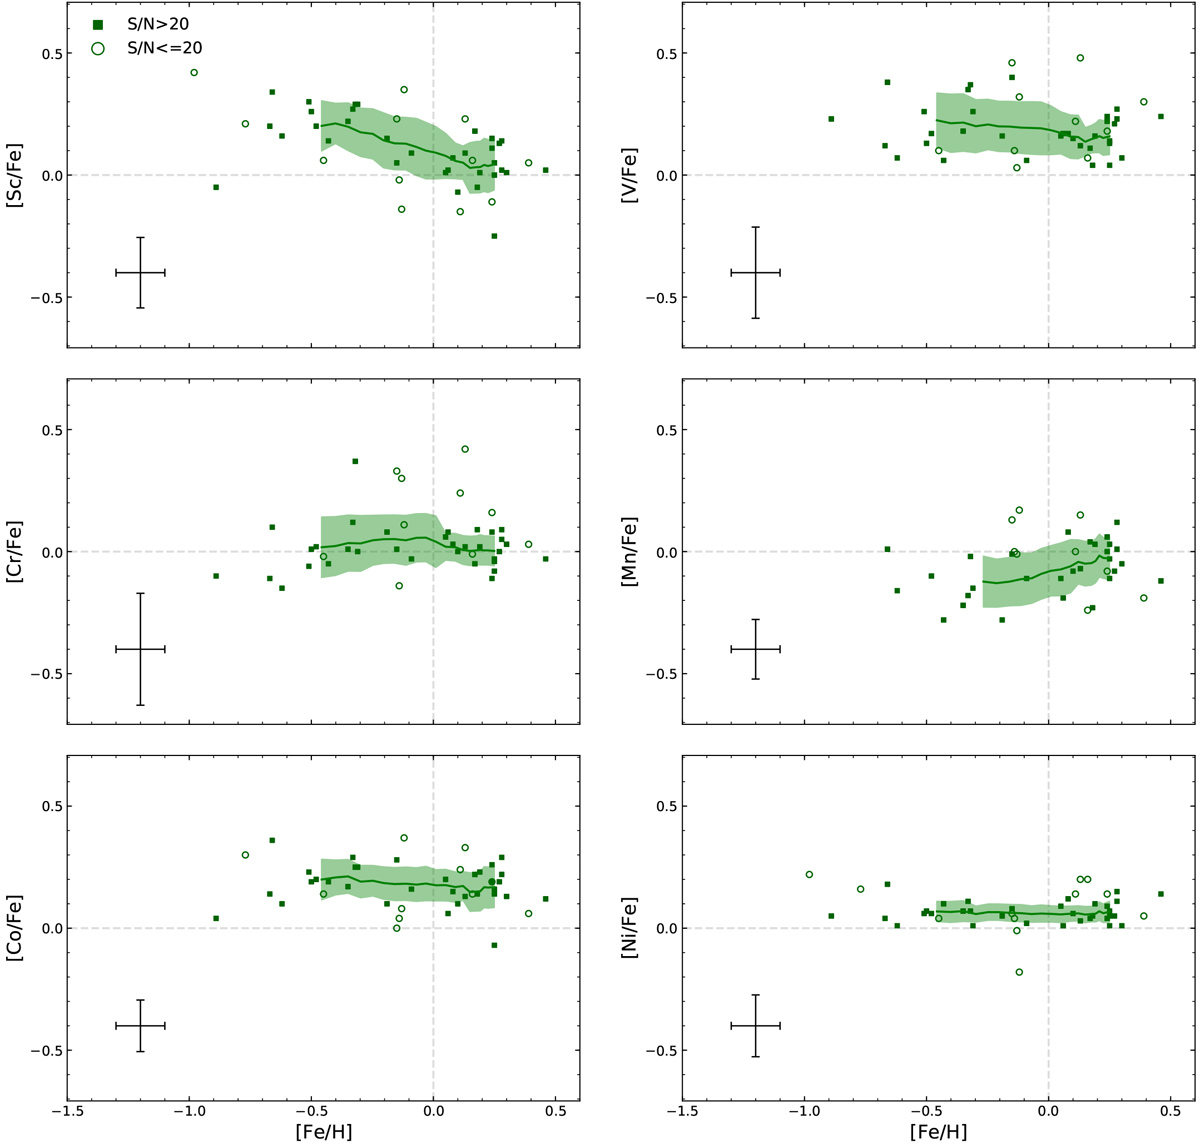
[X/Fe] vs. [Fe/H] trends (LTE) of the examined bulge giants: green squares denote stars with spectra having a S/N above 20, while the green empty circles denote stars having spectra with an S/N ≤ 20. The solid lines represent the running means and shaded areas show the 1σ scatter (only for stars with S/N > 20). The typical uncertainties for each element from Table 2 are also shown. In the plots we use A(Sc)⊙ = 3.04 (Pehlivan Rhodin et al. 2017), A(V)⊙ = 3.89, A(Cr)⊙ = 5.62, A(Mn)⊙ = 5.42, A(Fe)⊙ = 7.47, A(Co)⊙ = 4.93, and A(Ni)⊙ = 6.20 (Scott et al. 2015). For spectra with S/N ≤ 20 the uncertainty in [X/Fe] becomes significantly large (see Jönsson et al. 2017a).
Current usage metrics show cumulative count of Article Views (full-text article views including HTML views, PDF and ePub downloads, according to the available data) and Abstracts Views on Vision4Press platform.
Data correspond to usage on the plateform after 2015. The current usage metrics is available 48-96 hours after online publication and is updated daily on week days.
Initial download of the metrics may take a while.