Fig. 3
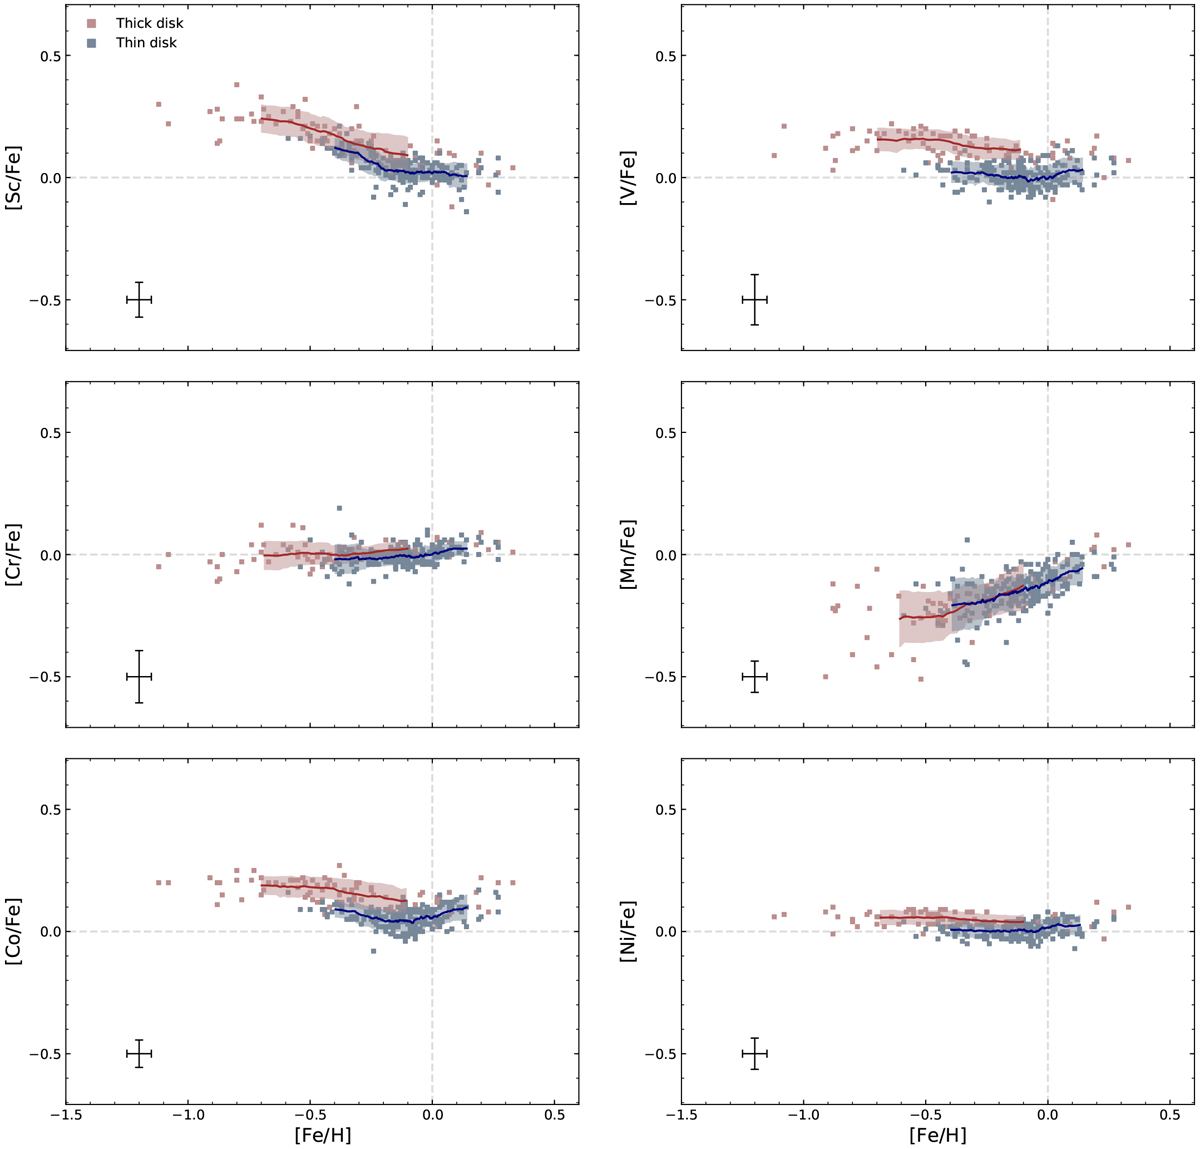
[X/Fe] vs. [Fe/H] trends (LTE) of the examined solar neighborhood giants: pink squares denote thick disk stars and blue squares denote thin disk stars. The running mean for the thick disk is the red solid line, for the thin disk the line is blue. The shaded areas are the running 1σ scatter of the thick (red) and thin (blue) disks. The typical uncertainties for each element from Table 2 are also shown in the plots. In the plots we use A(Sc)⊙ = 3.04 (Pehlivan Rhodin et al. 2017), A(V)⊙ = 3.89, A(Cr)⊙ = 5.62, A(Mn)⊙ = 5.42, A(Fe)⊙ = 7.47, A(Co)⊙ = 4.93, A(Ni)⊙ = 6.20 (Scott et al. 2015).
Current usage metrics show cumulative count of Article Views (full-text article views including HTML views, PDF and ePub downloads, according to the available data) and Abstracts Views on Vision4Press platform.
Data correspond to usage on the plateform after 2015. The current usage metrics is available 48-96 hours after online publication and is updated daily on week days.
Initial download of the metrics may take a while.