Free Access
Fig. 2
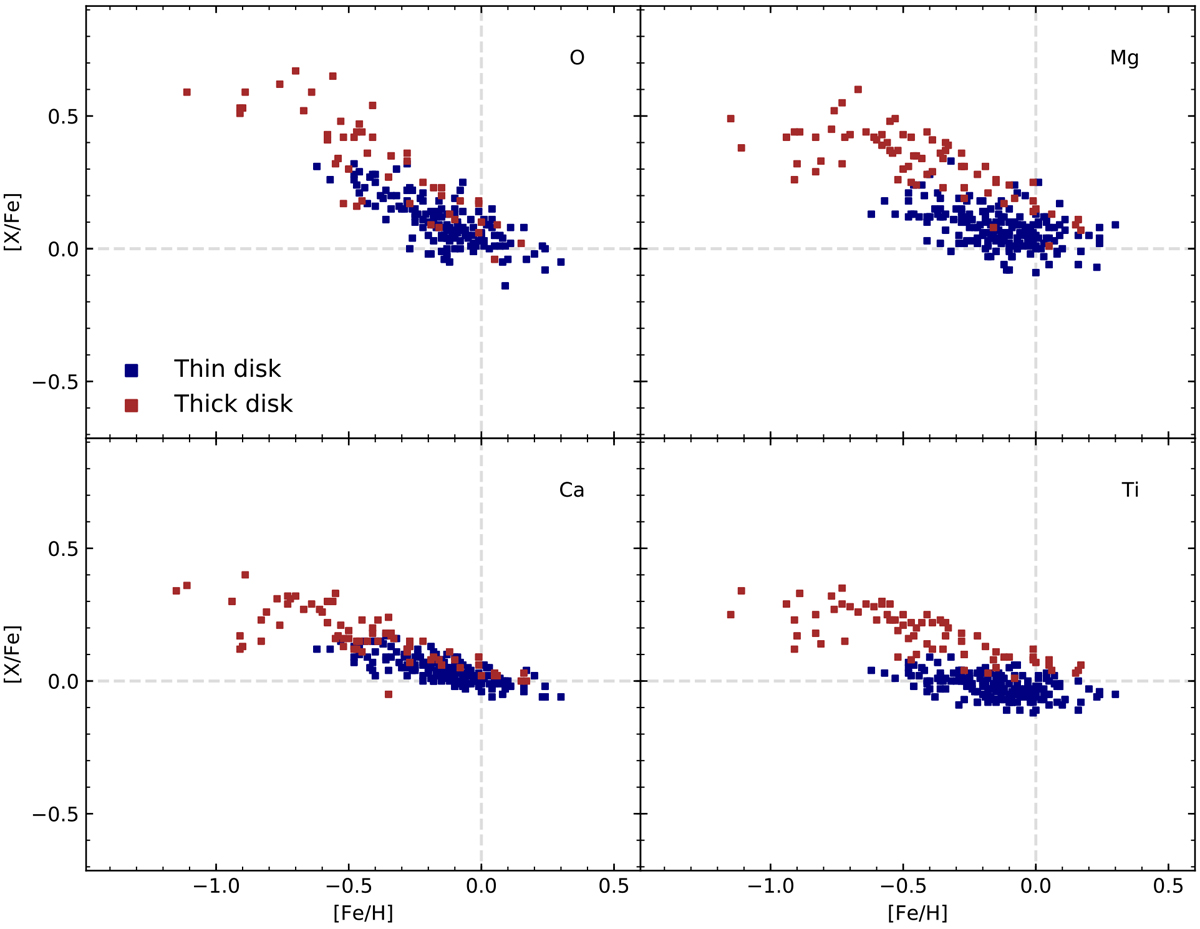
Thin and thick disk separation (blue and red squares, respectively) applied on the [(O, Mg, Ca, Ti)/Fe] vs. [Fe/H] trends from Jönsson et al. (2017a). The plots are shown in the same manner as in Jönsson et al. (2017a), i.e. with the solar abundances from Asplund et al. (2009).
Current usage metrics show cumulative count of Article Views (full-text article views including HTML views, PDF and ePub downloads, according to the available data) and Abstracts Views on Vision4Press platform.
Data correspond to usage on the plateform after 2015. The current usage metrics is available 48-96 hours after online publication and is updated daily on week days.
Initial download of the metrics may take a while.