Free Access
Fig. B.4
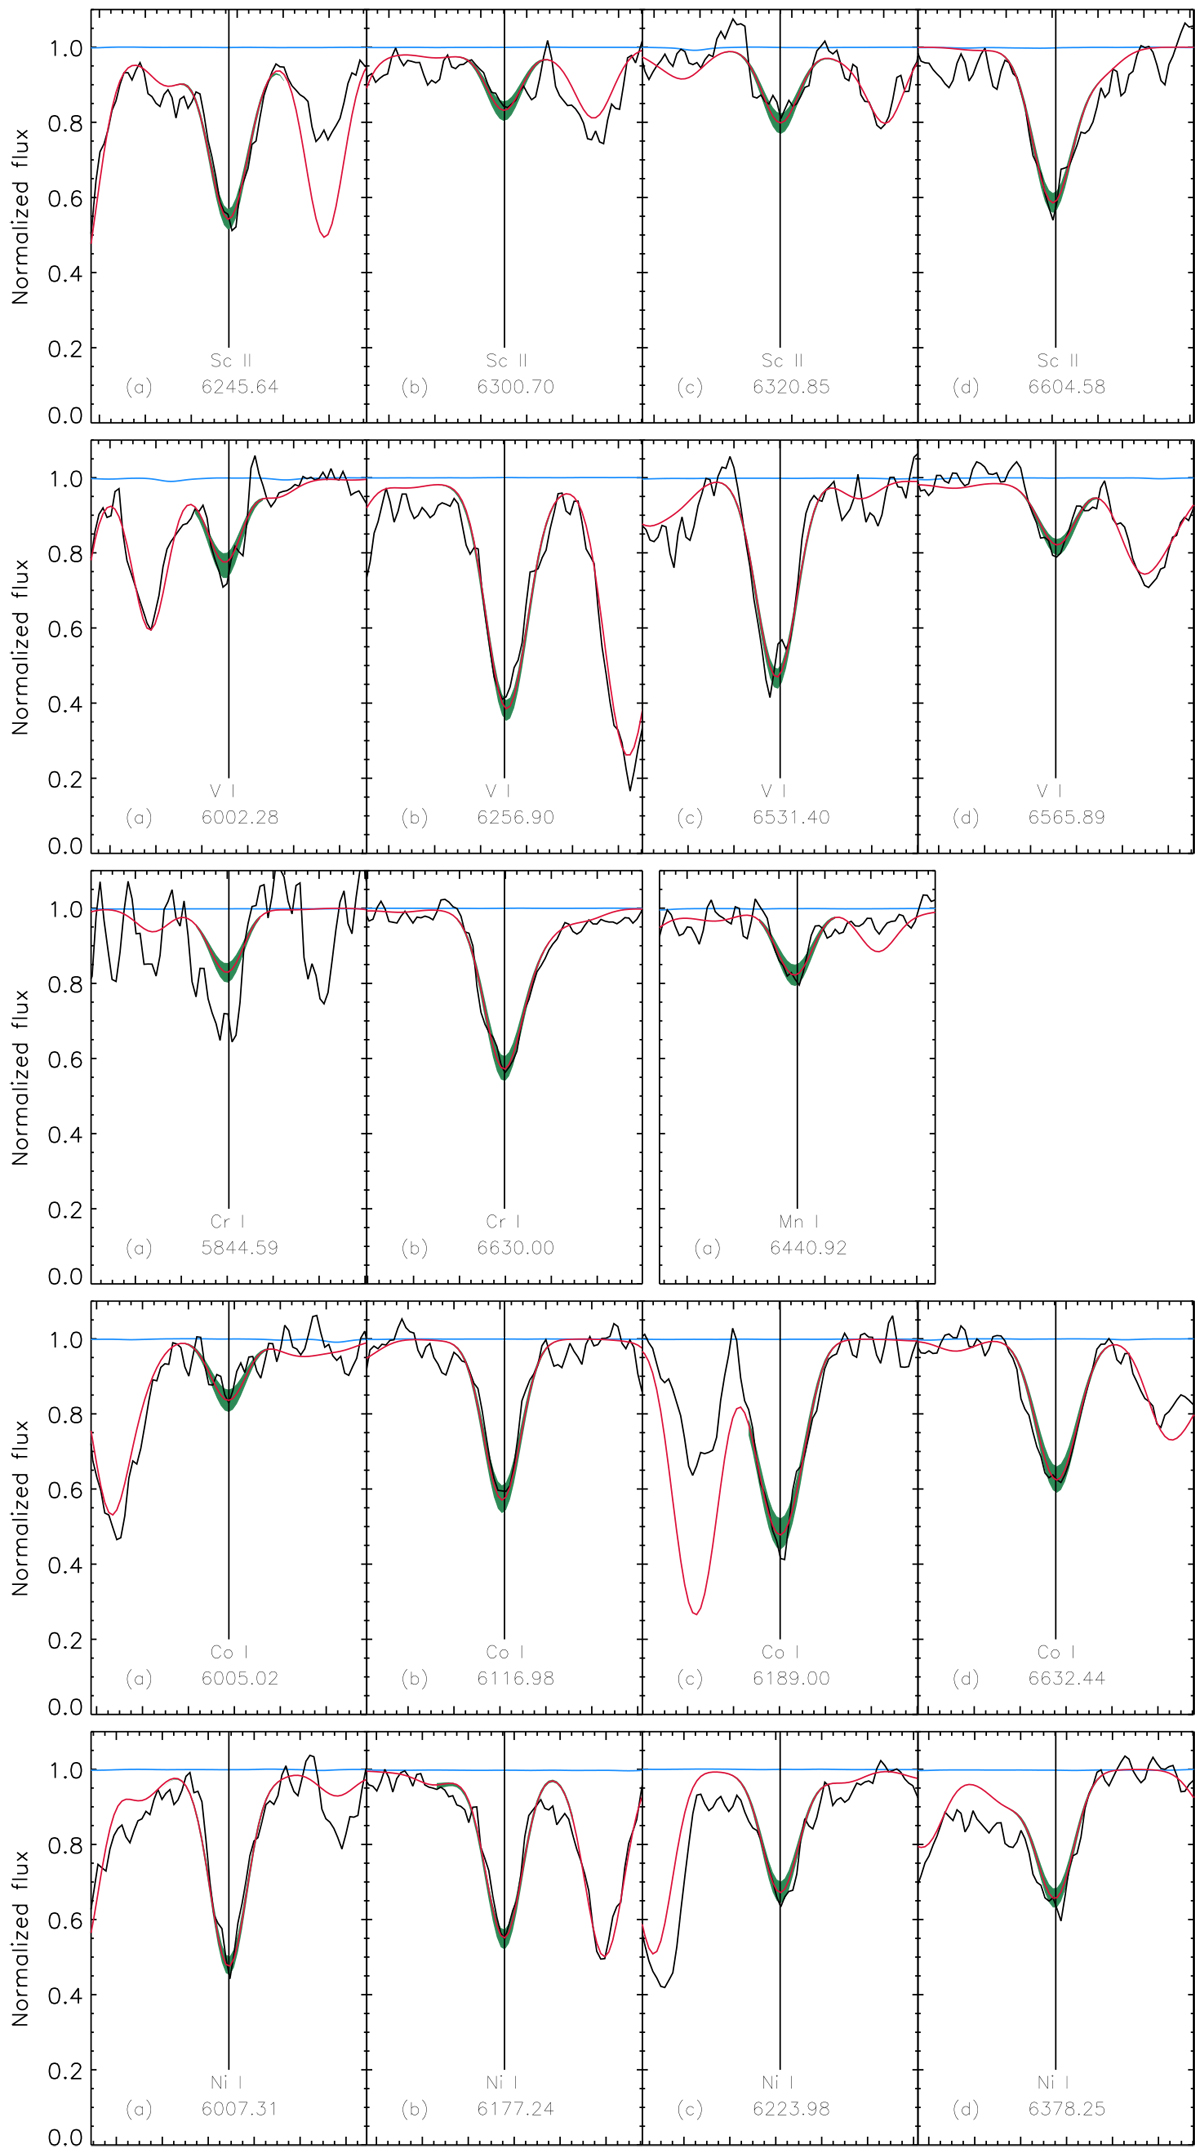
Stellar lines used for the calculations of the line-by-line abundance scatter and for the abundance determination in the analysis in the spectrum of B3-f1 (same color notations and axes as in Fig. B.3). The Cr I line in panel a is strongly affected by the noise and was not used in the final abundance measurement.
Current usage metrics show cumulative count of Article Views (full-text article views including HTML views, PDF and ePub downloads, according to the available data) and Abstracts Views on Vision4Press platform.
Data correspond to usage on the plateform after 2015. The current usage metrics is available 48-96 hours after online publication and is updated daily on week days.
Initial download of the metrics may take a while.