Fig. B.3
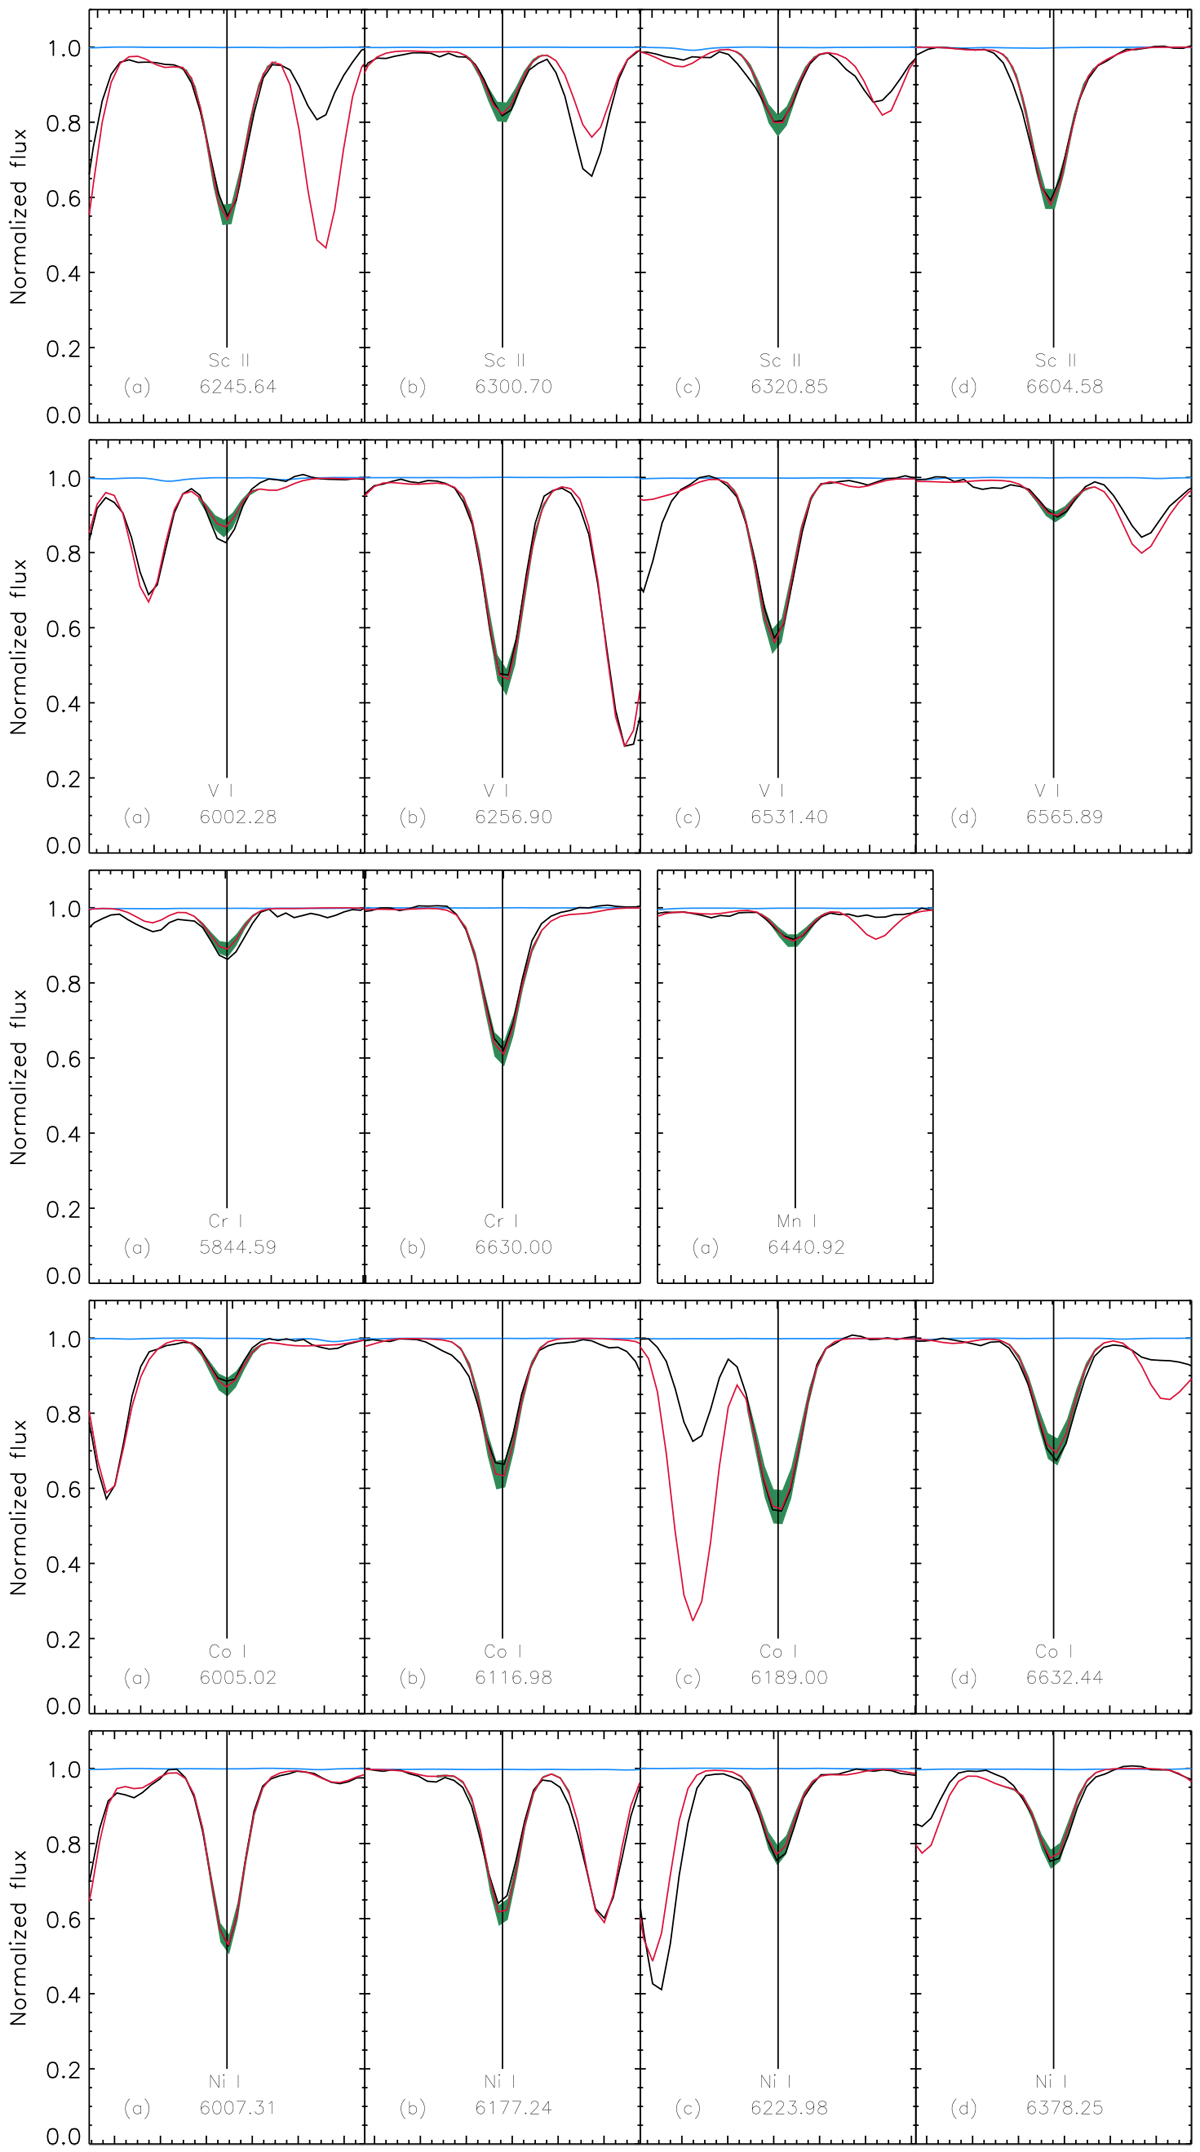
Stellar lines used for the calculations of the line-by-line abundance scatter and for the abundance determination in the analysis in the spectrum of αBoo. The black line is the observed spectrum, the red line is the fitted spectrum, and the blue line is the telluric spectrum from the αBoo atlas of Hinkle et al. (2000); in green is ±0.2 dex of the element in question. The wavelength range of each panel is 1.2 Å, i.e. the large tickmarks correspond to steps of 0.2 Å.
Current usage metrics show cumulative count of Article Views (full-text article views including HTML views, PDF and ePub downloads, according to the available data) and Abstracts Views on Vision4Press platform.
Data correspond to usage on the plateform after 2015. The current usage metrics is available 48-96 hours after online publication and is updated daily on week days.
Initial download of the metrics may take a while.