Free Access
Fig. B.2
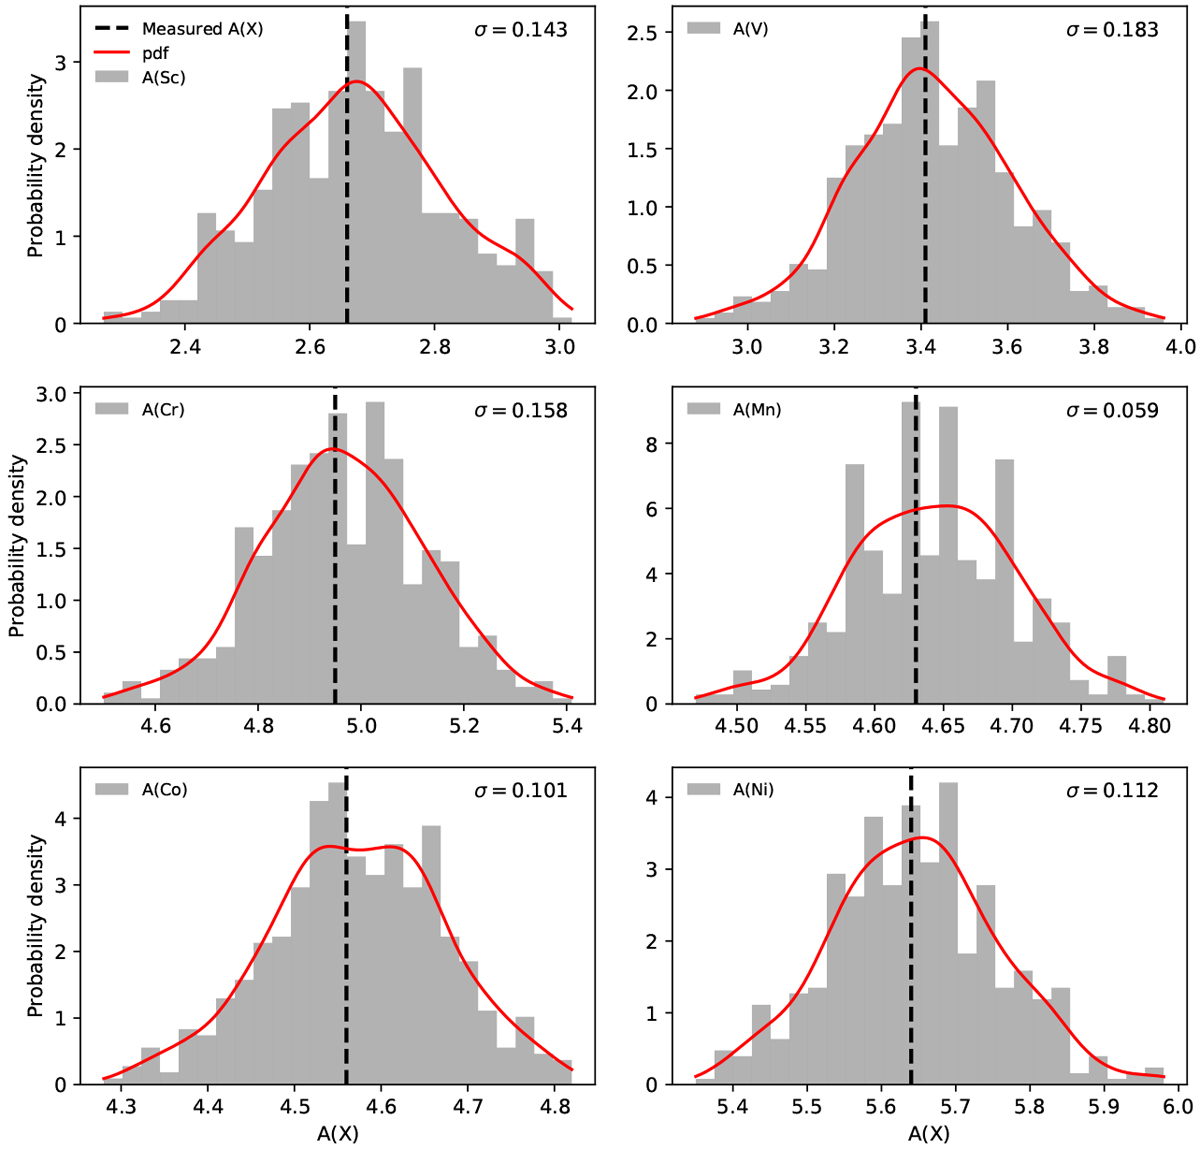
Histograms of the abundances determined from 500 synthetic data sets using the spectrum αBoo for the bulge sample. The red line denotes the estimated probability density function for each element, and σ is the standard deviation of each synthetic sample.
Current usage metrics show cumulative count of Article Views (full-text article views including HTML views, PDF and ePub downloads, according to the available data) and Abstracts Views on Vision4Press platform.
Data correspond to usage on the plateform after 2015. The current usage metrics is available 48-96 hours after online publication and is updated daily on week days.
Initial download of the metrics may take a while.