Fig. 14
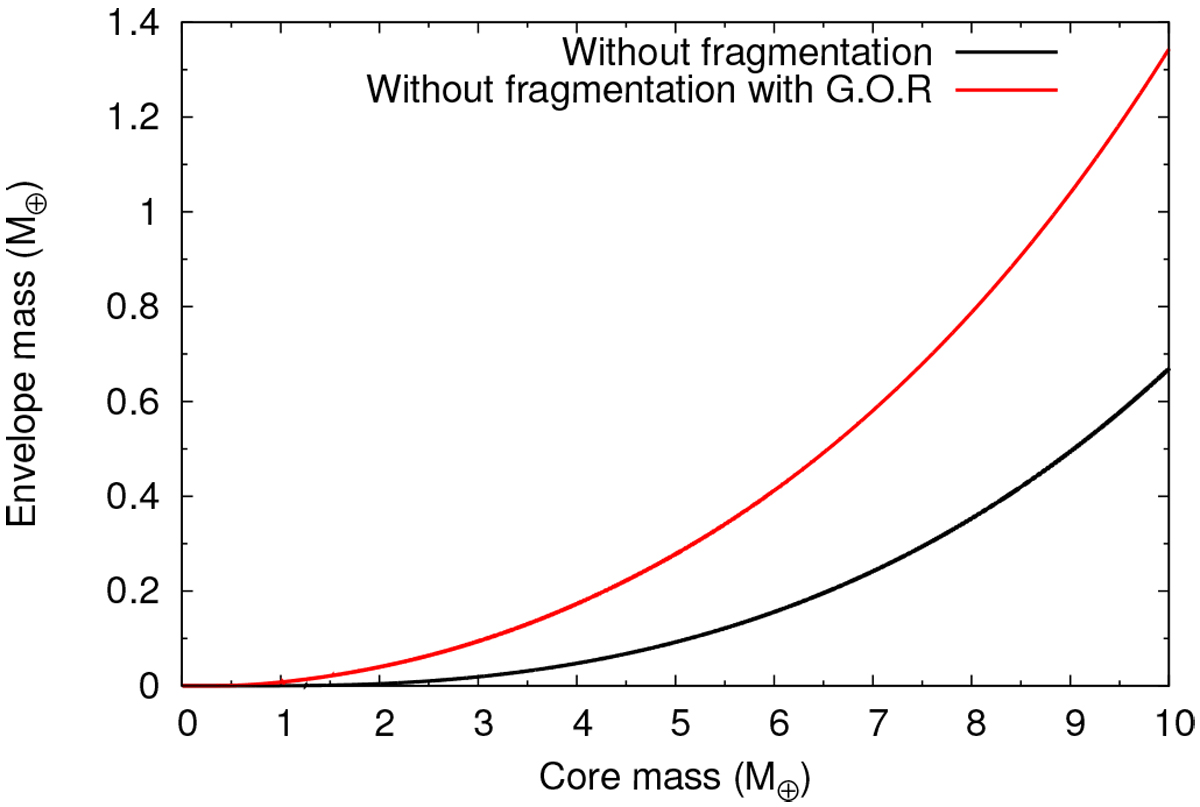
Envelope mass as a function of the core mass for the two cases where planetesimal fragmentation is not considered. We plot the core mass until 10 M⊕ in order to show more clearly the differences at low-mass core values. The black line represents the case where grain opacities are not reduced, while the red line represents the case where grain opacities are reduced in the planet envelope.
Current usage metrics show cumulative count of Article Views (full-text article views including HTML views, PDF and ePub downloads, according to the available data) and Abstracts Views on Vision4Press platform.
Data correspond to usage on the plateform after 2015. The current usage metrics is available 48-96 hours after online publication and is updated daily on week days.
Initial download of the metrics may take a while.