Free Access
Fig. 12
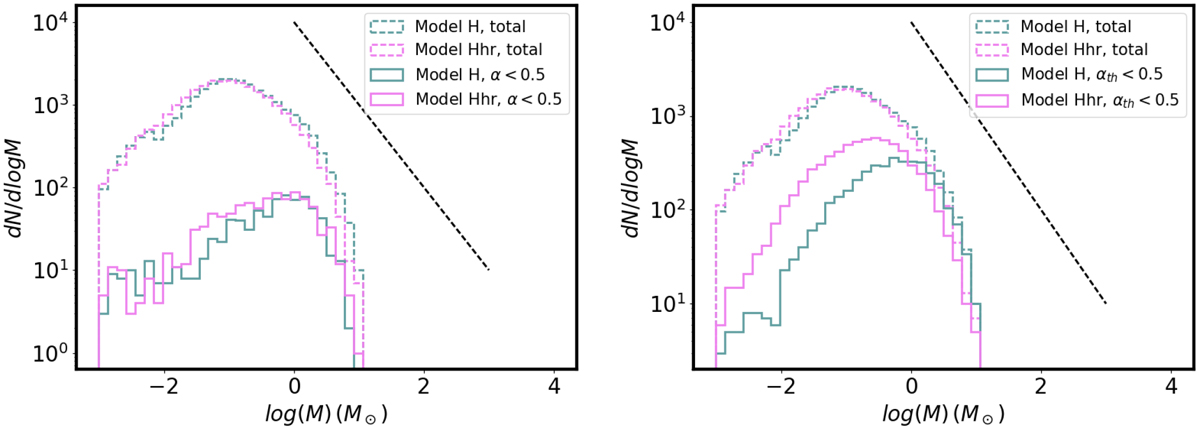
Massdistributions of the cores with α < 0.5 (left) and αth < 0.5 (right) for Models H and Hhr, at reference times HHhr2. As in previous figures, the dashed line shows the Salpeter IMF slope.
Current usage metrics show cumulative count of Article Views (full-text article views including HTML views, PDF and ePub downloads, according to the available data) and Abstracts Views on Vision4Press platform.
Data correspond to usage on the plateform after 2015. The current usage metrics is available 48-96 hours after online publication and is updated daily on week days.
Initial download of the metrics may take a while.