Fig. 11
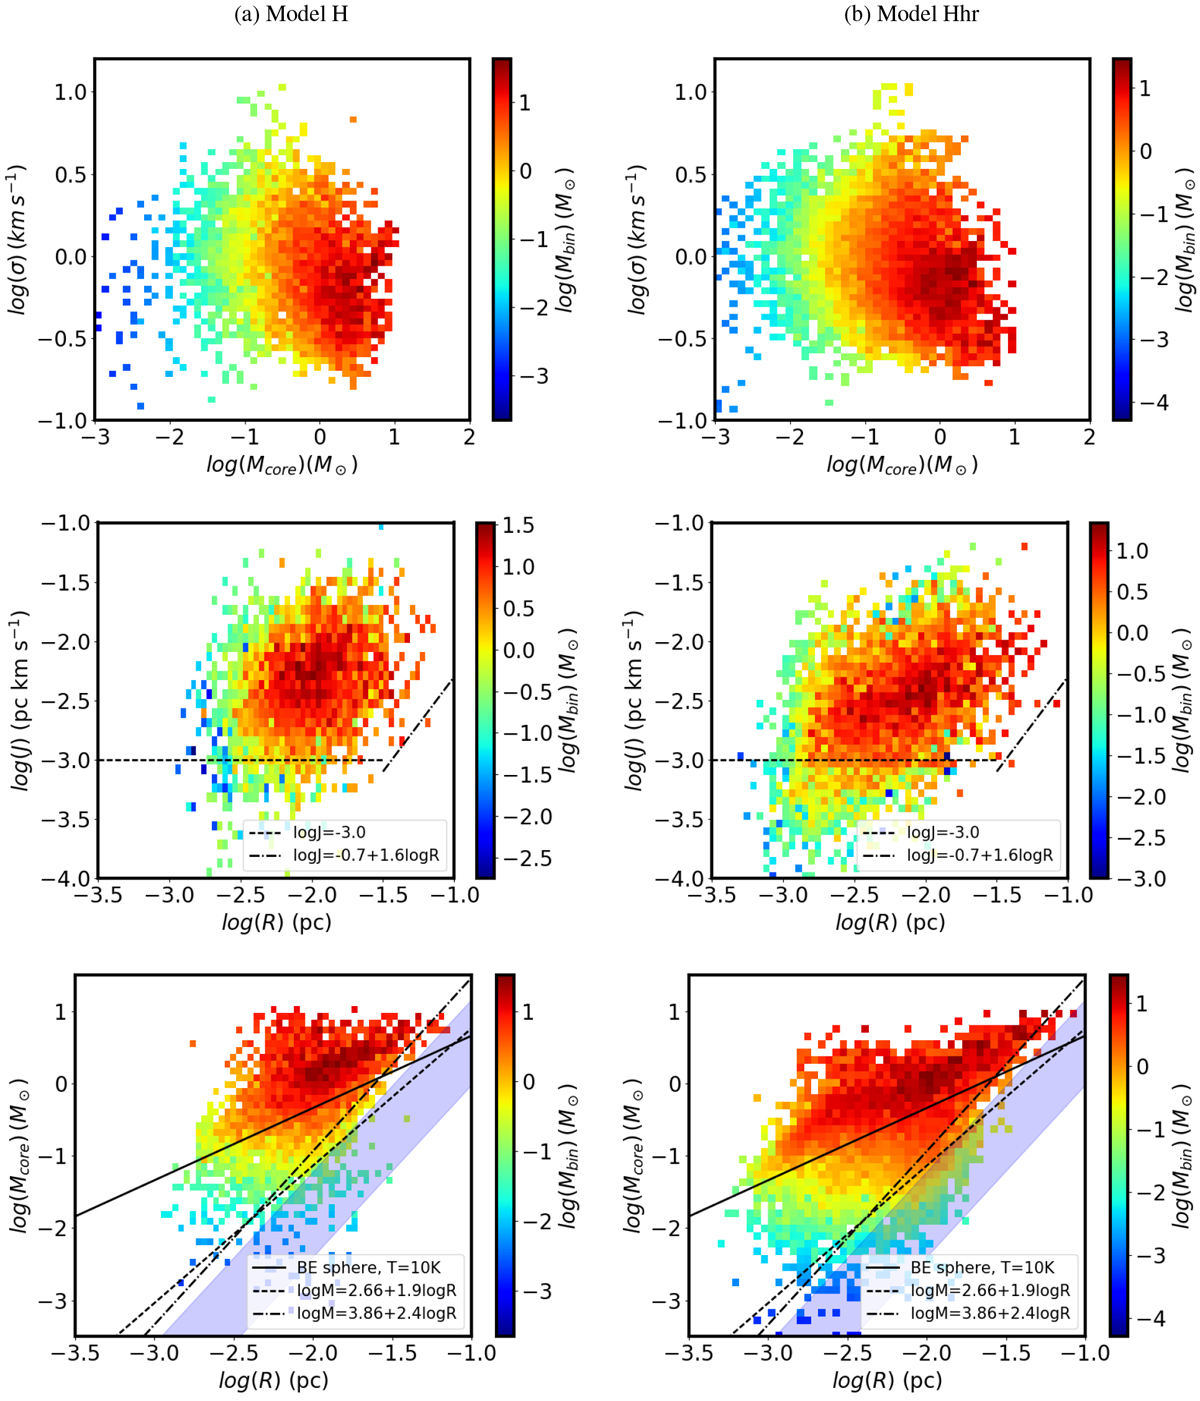
Mass-weighted 2D histograms showing the core properties at reference times HHhr2. As in Fig. 7, from top to bottom, 3D velocity dispersion as a function of core mass, specific angular momentum as a function of core size, and mass-size relation, with the observed relations as dashed lines, and the mass-size relation for a critical Bonnor–Ebert sphere as a black solid line. Only thermally unstable cores are shown.
Current usage metrics show cumulative count of Article Views (full-text article views including HTML views, PDF and ePub downloads, according to the available data) and Abstracts Views on Vision4Press platform.
Data correspond to usage on the plateform after 2015. The current usage metrics is available 48-96 hours after online publication and is updated daily on week days.
Initial download of the metrics may take a while.