Fig. 6.
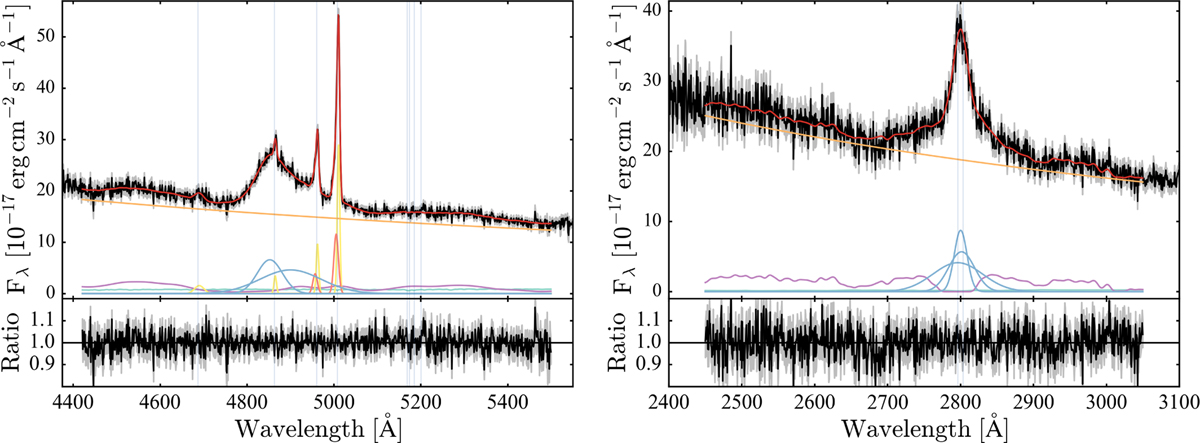
Examples of model fits to the Hβ (left panel; plate = 1159, MJD = 52669, fiber = 470) and MgII (right panel; plate = 423, MJD = 51821, fiber = 250) spectral regions. The model components are colour-coded as follows; power law (orange), iron emission (violet), broad lines (blue), narrow lines (yellow), [OIII] shifted wings (red), and the total model (red). The panels beneath the spectra show the data/model ratio.
Current usage metrics show cumulative count of Article Views (full-text article views including HTML views, PDF and ePub downloads, according to the available data) and Abstracts Views on Vision4Press platform.
Data correspond to usage on the plateform after 2015. The current usage metrics is available 48-96 hours after online publication and is updated daily on week days.
Initial download of the metrics may take a while.