Fig. 5.
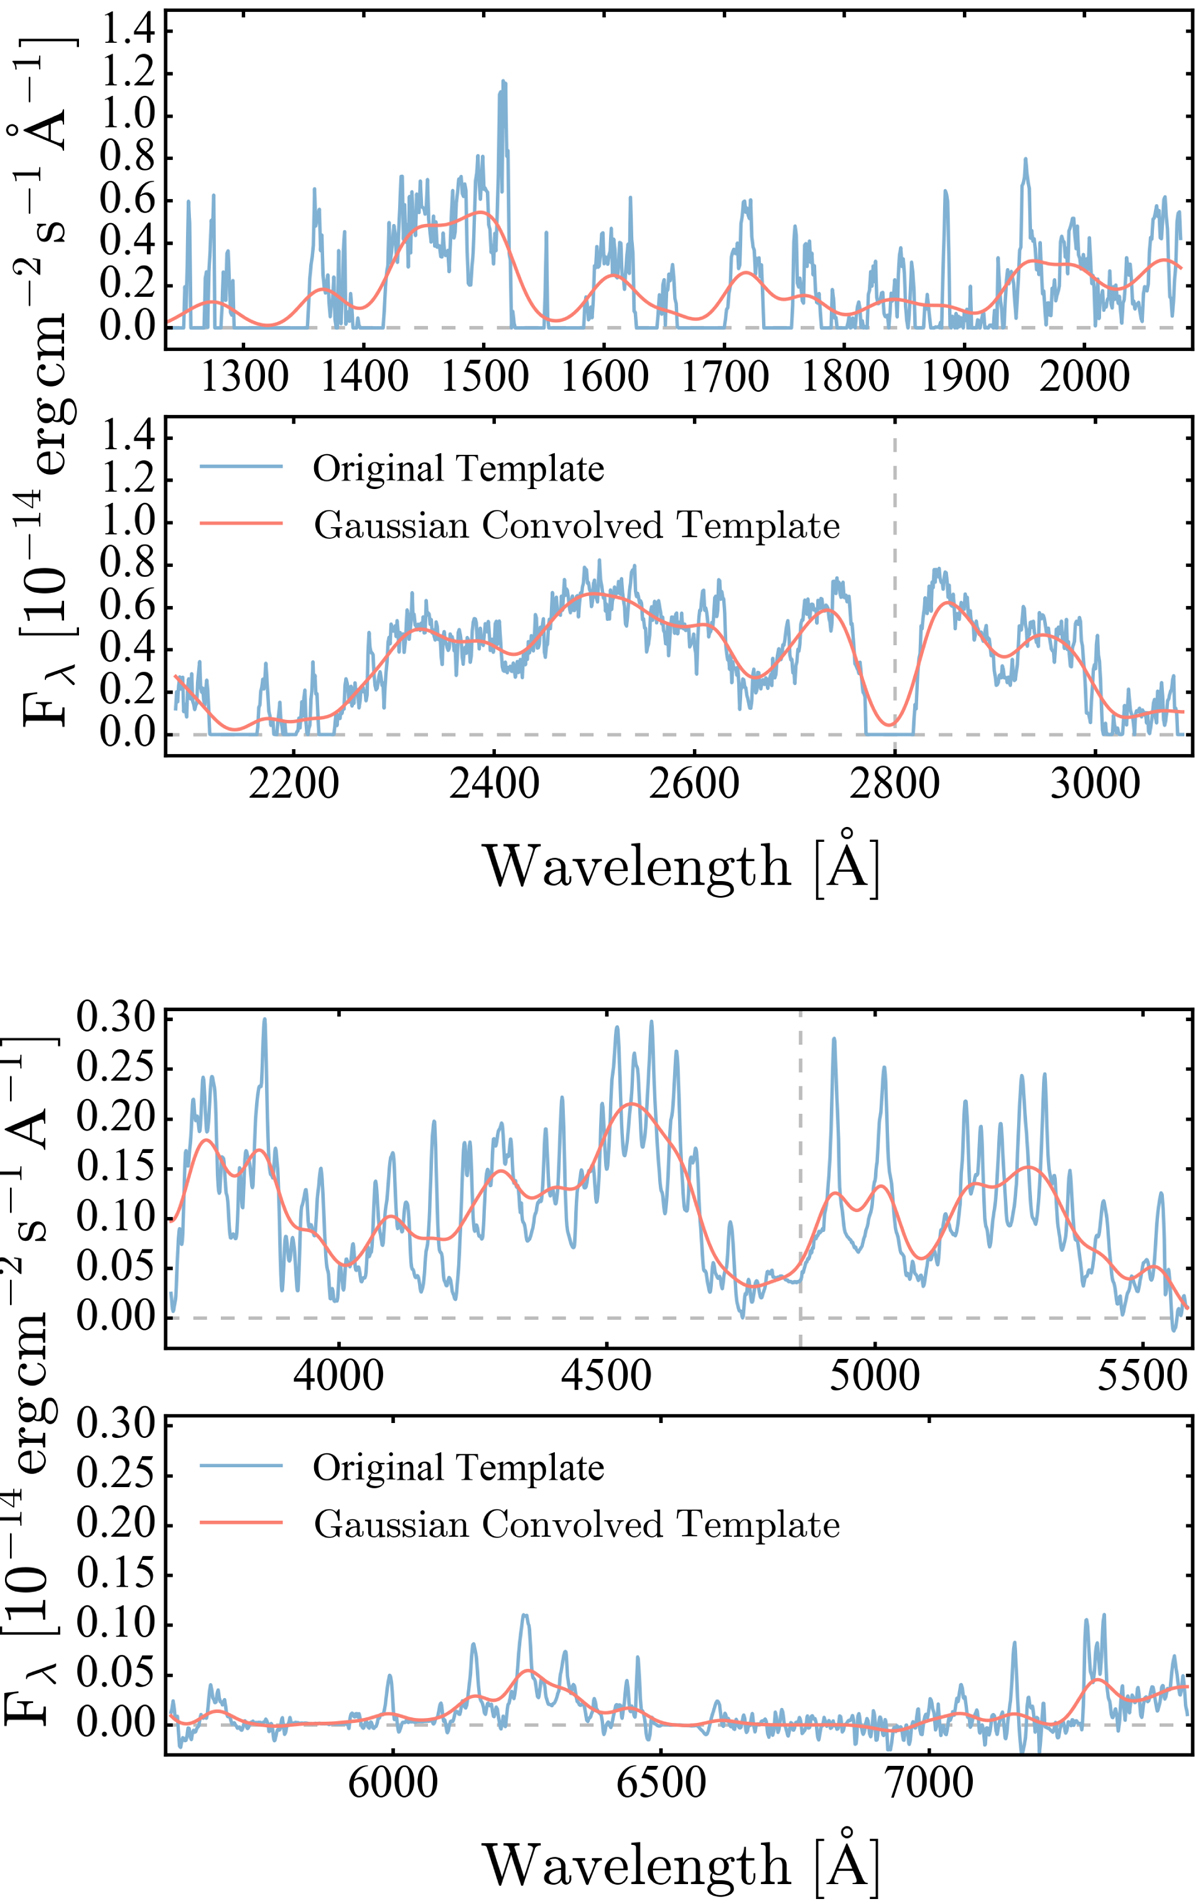
Upper panel: Vestergaard & Wilkes (2001) FeII template which was used when fitting the MgII emission line region. Lower panel: Boroson & Green (1992) FeII template which was used when fitting the Hβ emission line region. In both cases, the original template is shown (blue) along with the same template convolved with a Gaussian with FWHM = 4000 km s−1 (red). The vertical dashed lines correspond to the position of MgII and Hβ at 2800 Å and 4861 Å.
Current usage metrics show cumulative count of Article Views (full-text article views including HTML views, PDF and ePub downloads, according to the available data) and Abstracts Views on Vision4Press platform.
Data correspond to usage on the plateform after 2015. The current usage metrics is available 48-96 hours after online publication and is updated daily on week days.
Initial download of the metrics may take a while.