Fig. 3.
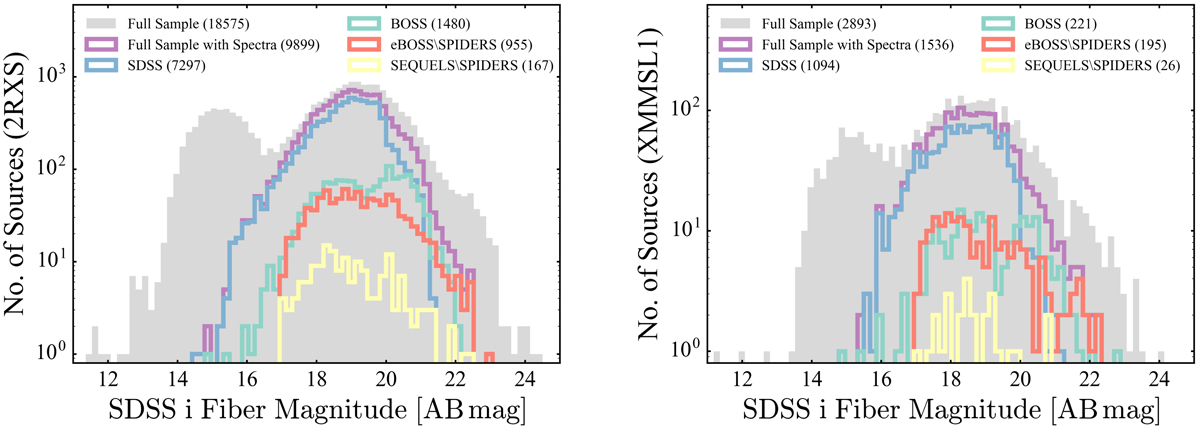
Distribution of i-band fiber magnitudes (fiber2Mag). The coloured curves represent all of the sources with spectra, and the survey from which the spectra were taken. The grey histogram displays the X-ray sources with a reliable SDSS photometric counterpart, including stars which cannot be targets for spectroscopy due to their brightness.
Current usage metrics show cumulative count of Article Views (full-text article views including HTML views, PDF and ePub downloads, according to the available data) and Abstracts Views on Vision4Press platform.
Data correspond to usage on the plateform after 2015. The current usage metrics is available 48-96 hours after online publication and is updated daily on week days.
Initial download of the metrics may take a while.