Fig. 17.
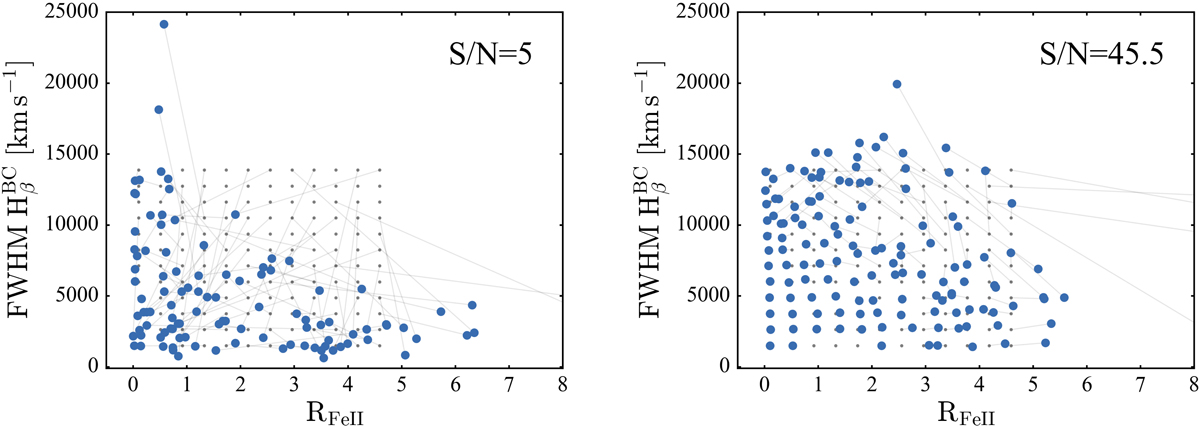
Comparison between the measured and simulated RFeII and ![]() values for the highest and lowest S/N bins used in Sect. 9.1.2. For clarity, each figure displays only one of the ten sets of spectra for that S/N. The values used to simulate the spectra (grey points) are connected to the corresponding best fit measurements (except for cases where either the broad Hβ or FeII components were not detected). For clarity, the figures do not show a small number of unphysically high RFeII measurements.
values for the highest and lowest S/N bins used in Sect. 9.1.2. For clarity, each figure displays only one of the ten sets of spectra for that S/N. The values used to simulate the spectra (grey points) are connected to the corresponding best fit measurements (except for cases where either the broad Hβ or FeII components were not detected). For clarity, the figures do not show a small number of unphysically high RFeII measurements.
Current usage metrics show cumulative count of Article Views (full-text article views including HTML views, PDF and ePub downloads, according to the available data) and Abstracts Views on Vision4Press platform.
Data correspond to usage on the plateform after 2015. The current usage metrics is available 48-96 hours after online publication and is updated daily on week days.
Initial download of the metrics may take a while.