Fig. 16.
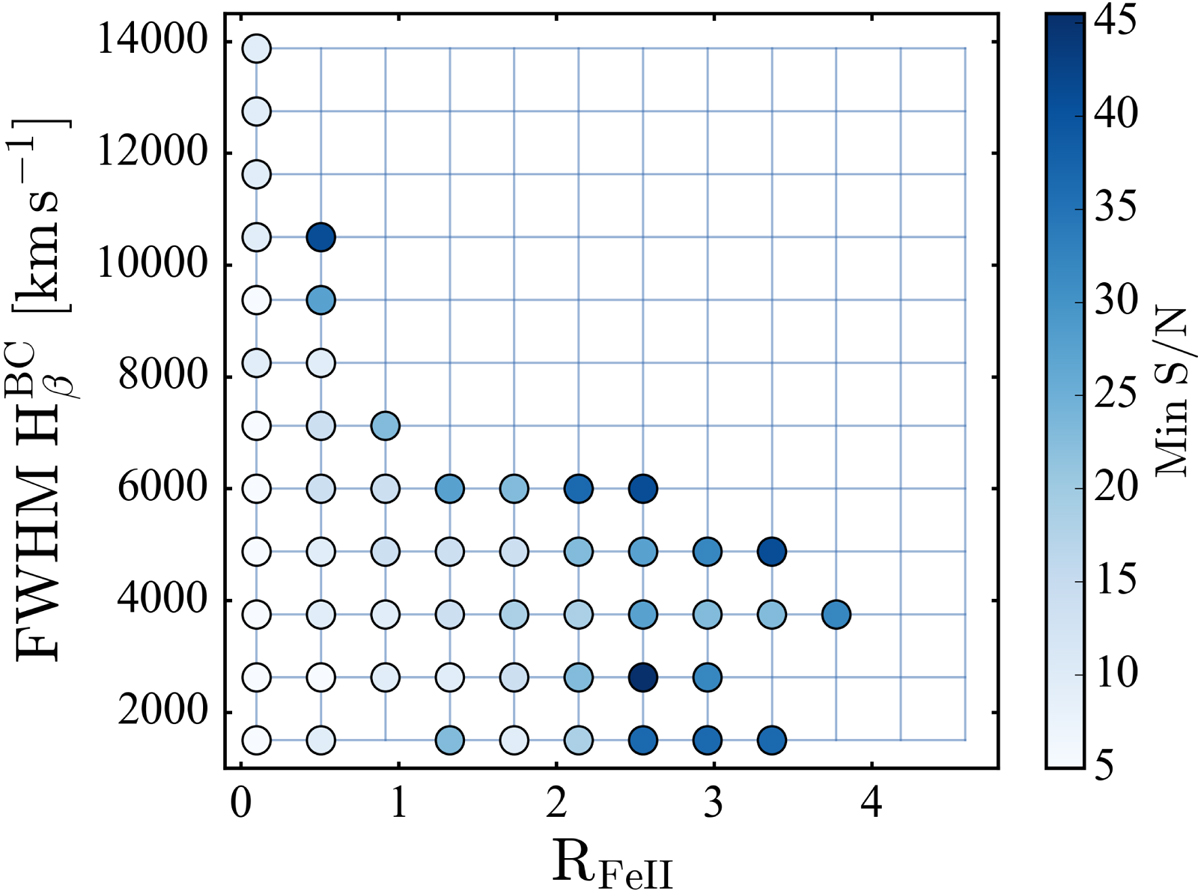
Minimum S/N required to detect a range of RFeII and ![]() combinations. The blue grid indicates the range of the parameter space covered in the simulation described in Sect. 9.1.2. Points on the grid that do not have a minimum S/N indicator represent RFeII and
combinations. The blue grid indicates the range of the parameter space covered in the simulation described in Sect. 9.1.2. Points on the grid that do not have a minimum S/N indicator represent RFeII and ![]() combinations that are not detectable even at the highest S/N used in this experiment. Sources detected at these RFeII and
combinations that are not detectable even at the highest S/N used in this experiment. Sources detected at these RFeII and ![]() combinations are likely to be spurious (see Fig. 17).
combinations are likely to be spurious (see Fig. 17).
Current usage metrics show cumulative count of Article Views (full-text article views including HTML views, PDF and ePub downloads, according to the available data) and Abstracts Views on Vision4Press platform.
Data correspond to usage on the plateform after 2015. The current usage metrics is available 48-96 hours after online publication and is updated daily on week days.
Initial download of the metrics may take a while.