Fig. 13.
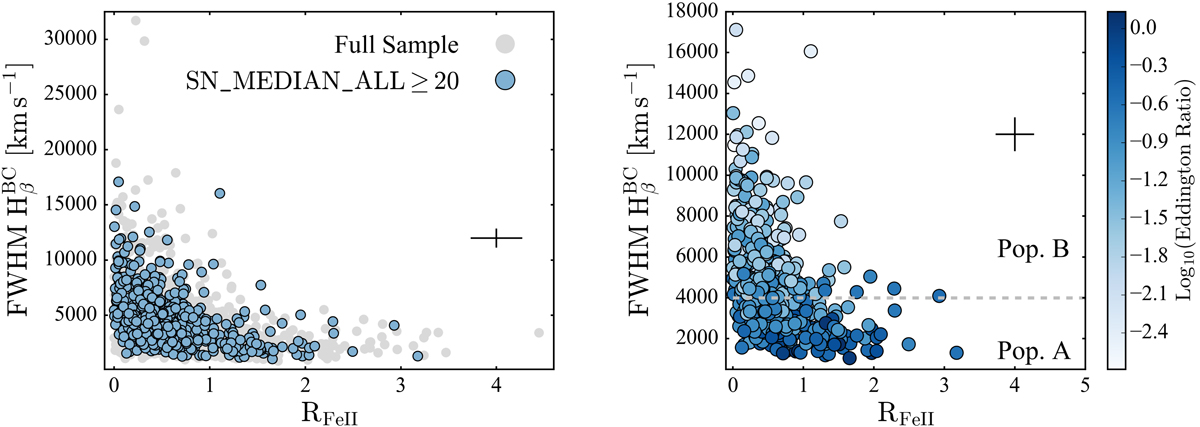
FWHM of the broad component of Hβ versus RFeII. The left panel displays the sample described in Sect. 8.2 (grey), and sources with a median spectral S/N ≥ 20 (blue). The right panel presents the same subsample of high S/N sources, colour coded to indicate the trend in Eddington ratio across the distribution. The grey dashed line marks the division between population A (![]() ) and population B (
) and population B (![]() ) sources. The size of the typical uncertainties, multiplied by a factor of five, in both variables for the high-S/N subsample is also shown.
) sources. The size of the typical uncertainties, multiplied by a factor of five, in both variables for the high-S/N subsample is also shown.
Current usage metrics show cumulative count of Article Views (full-text article views including HTML views, PDF and ePub downloads, according to the available data) and Abstracts Views on Vision4Press platform.
Data correspond to usage on the plateform after 2015. The current usage metrics is available 48-96 hours after online publication and is updated daily on week days.
Initial download of the metrics may take a while.