Open Access
Fig. 12.
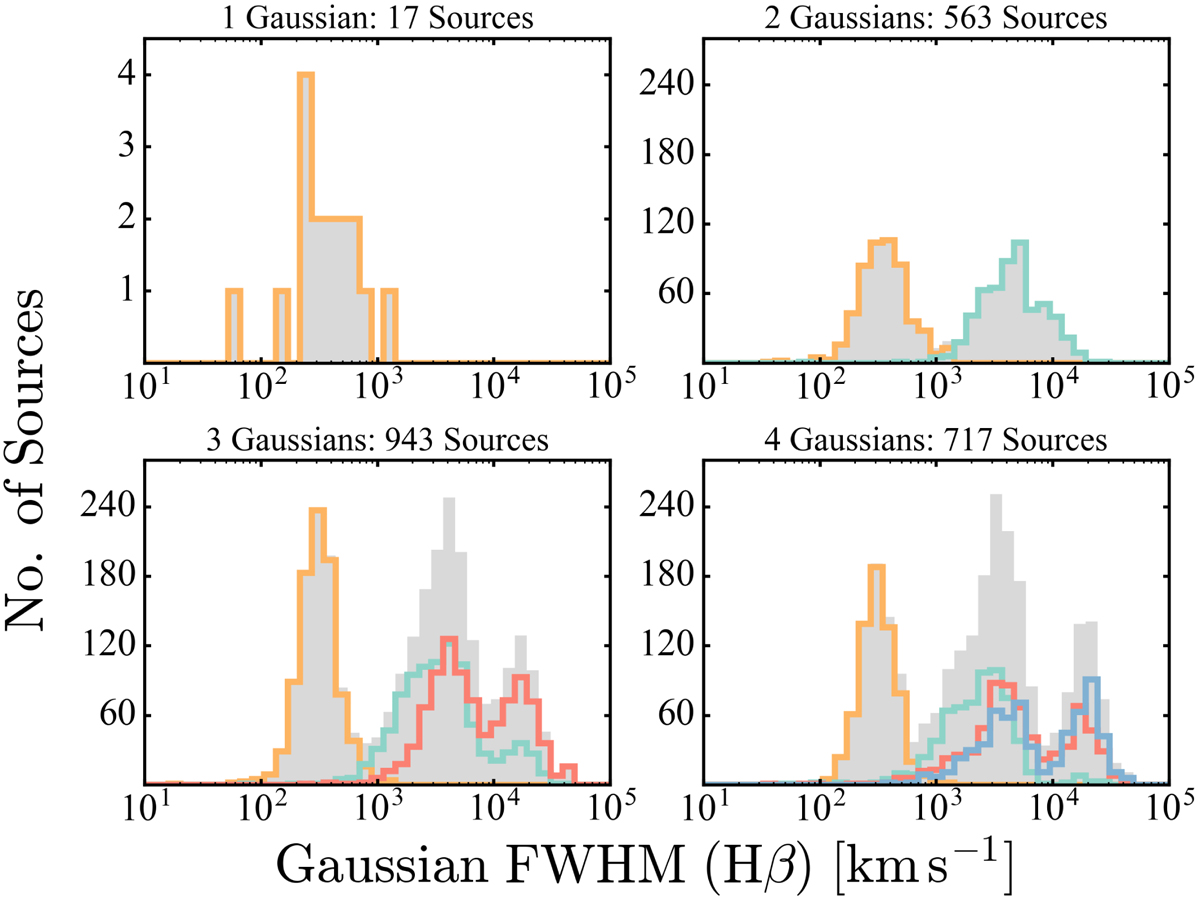
Distribution of Hβ Gaussian FWHM values. The panels are split based on the number of Gaussians required to fit the line. The coloured histograms each represent one of up to four possible Gaussians used to fit the Hβ line. The grey histograms represent the sum of the individual coloured histograms.
Current usage metrics show cumulative count of Article Views (full-text article views including HTML views, PDF and ePub downloads, according to the available data) and Abstracts Views on Vision4Press platform.
Data correspond to usage on the plateform after 2015. The current usage metrics is available 48-96 hours after online publication and is updated daily on week days.
Initial download of the metrics may take a while.