Open Access
Fig. 7
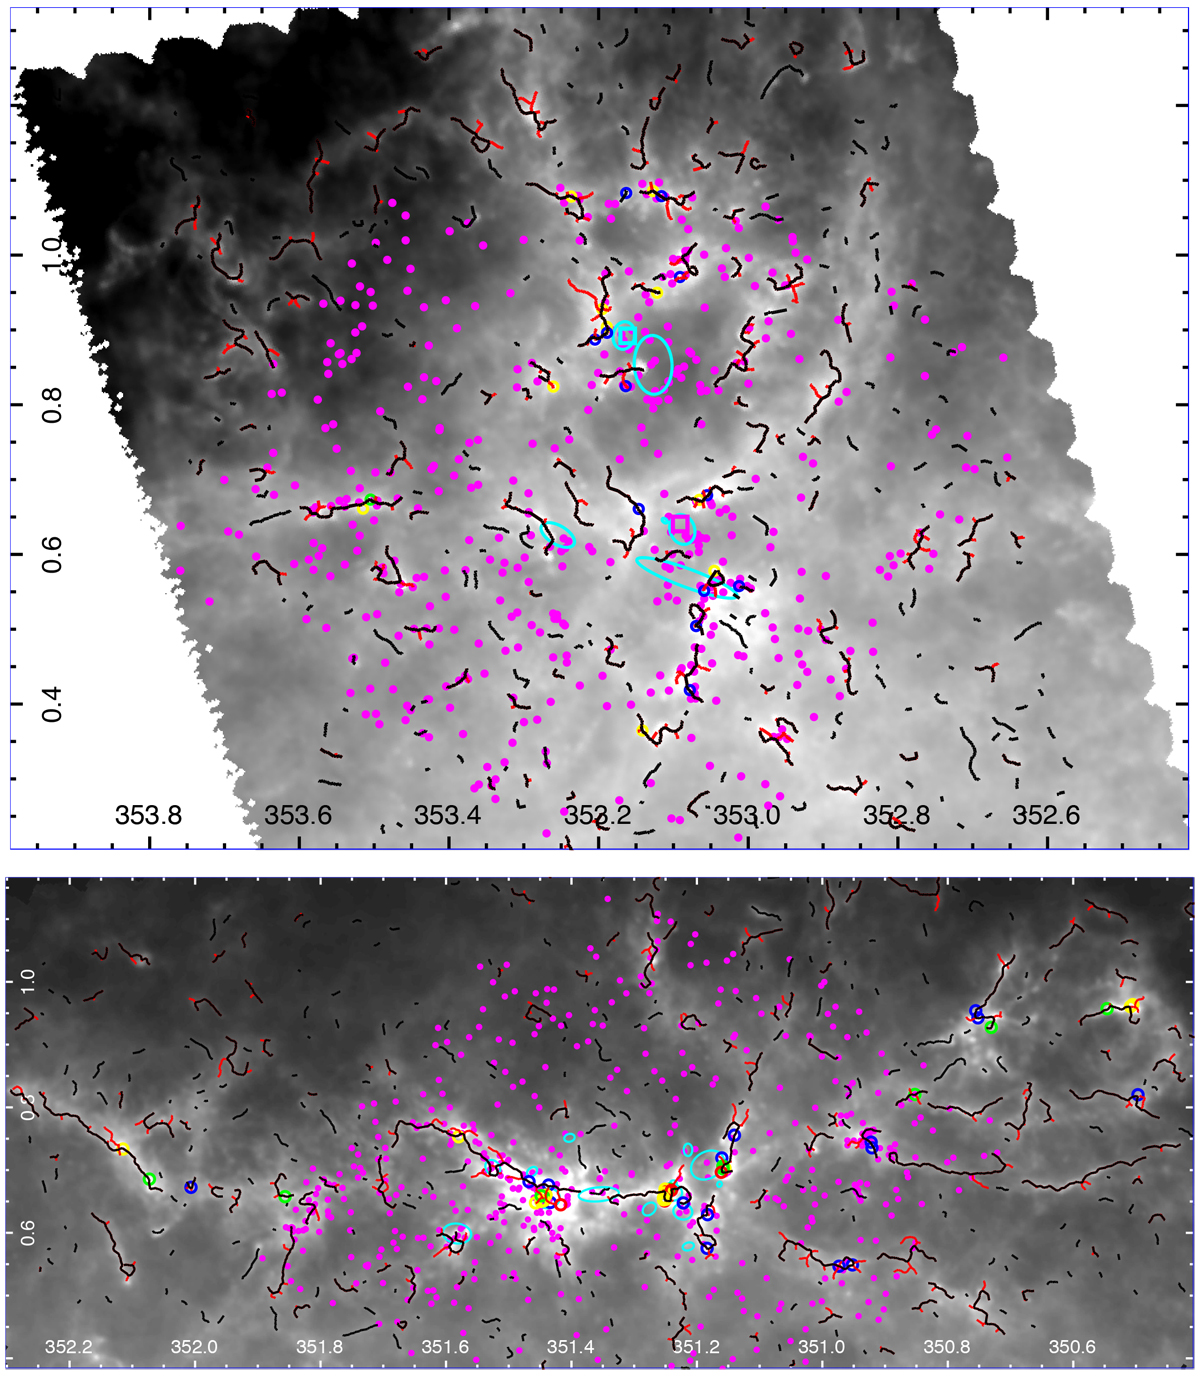
NGC 6357 (upper panel) and NGC 6334 (lower panel) column density maps overlaid with class 0/I YSOs from Povich et al. (2017) (magenta dots), filaments spines (black lines) and branches (red lines) and young stellar clusters from Kuhn et al. (2015) (cyan ellipses). The MDCs colour coding is the same as in Fig. 4.
Current usage metrics show cumulative count of Article Views (full-text article views including HTML views, PDF and ePub downloads, according to the available data) and Abstracts Views on Vision4Press platform.
Data correspond to usage on the plateform after 2015. The current usage metrics is available 48-96 hours after online publication and is updated daily on week days.
Initial download of the metrics may take a while.