Fig. 6
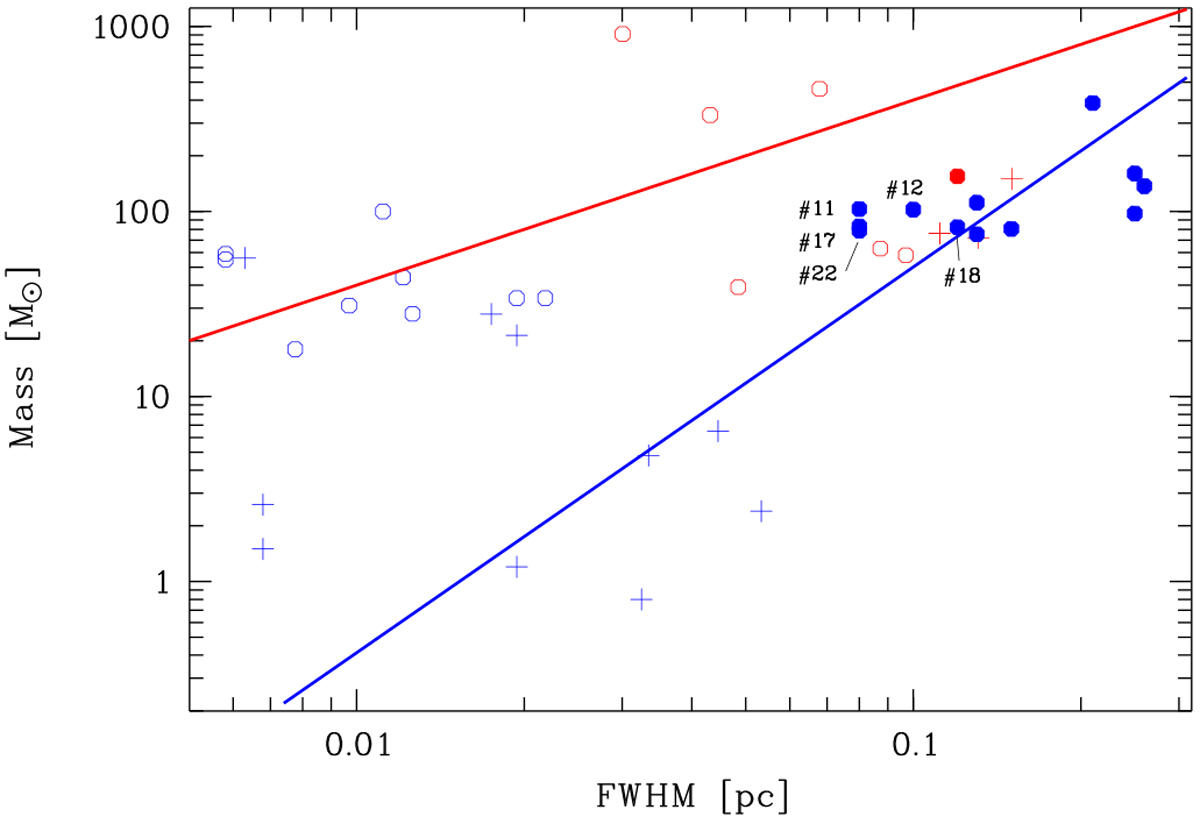
Mass versus size diagram. Starless and protostellar MDC candidates in NGC 6357 are displayed as blue and red dots respectively. For comparison, following Nony et al. (2018), we also display massive starless and protostellar MDCs (Motte et al. 2007; Tigé et al. 2017; Tan et al. 2013; Louvet et al. 2014) as red crosses and circles respectively, and pre-stellar and protostellar sub-fragments and cores (Motte et al. 2018b; Tan et al. 2013; Bontemps et al. 2010; Louvet et al. 2019)as blue crosses and circles respectively. The red and blue lines represent mass radial power-laws of Mass(<r) ∝ r and Mass(<r) ∝ r2.
Current usage metrics show cumulative count of Article Views (full-text article views including HTML views, PDF and ePub downloads, according to the available data) and Abstracts Views on Vision4Press platform.
Data correspond to usage on the plateform after 2015. The current usage metrics is available 48-96 hours after online publication and is updated daily on week days.
Initial download of the metrics may take a while.