Fig. D.1
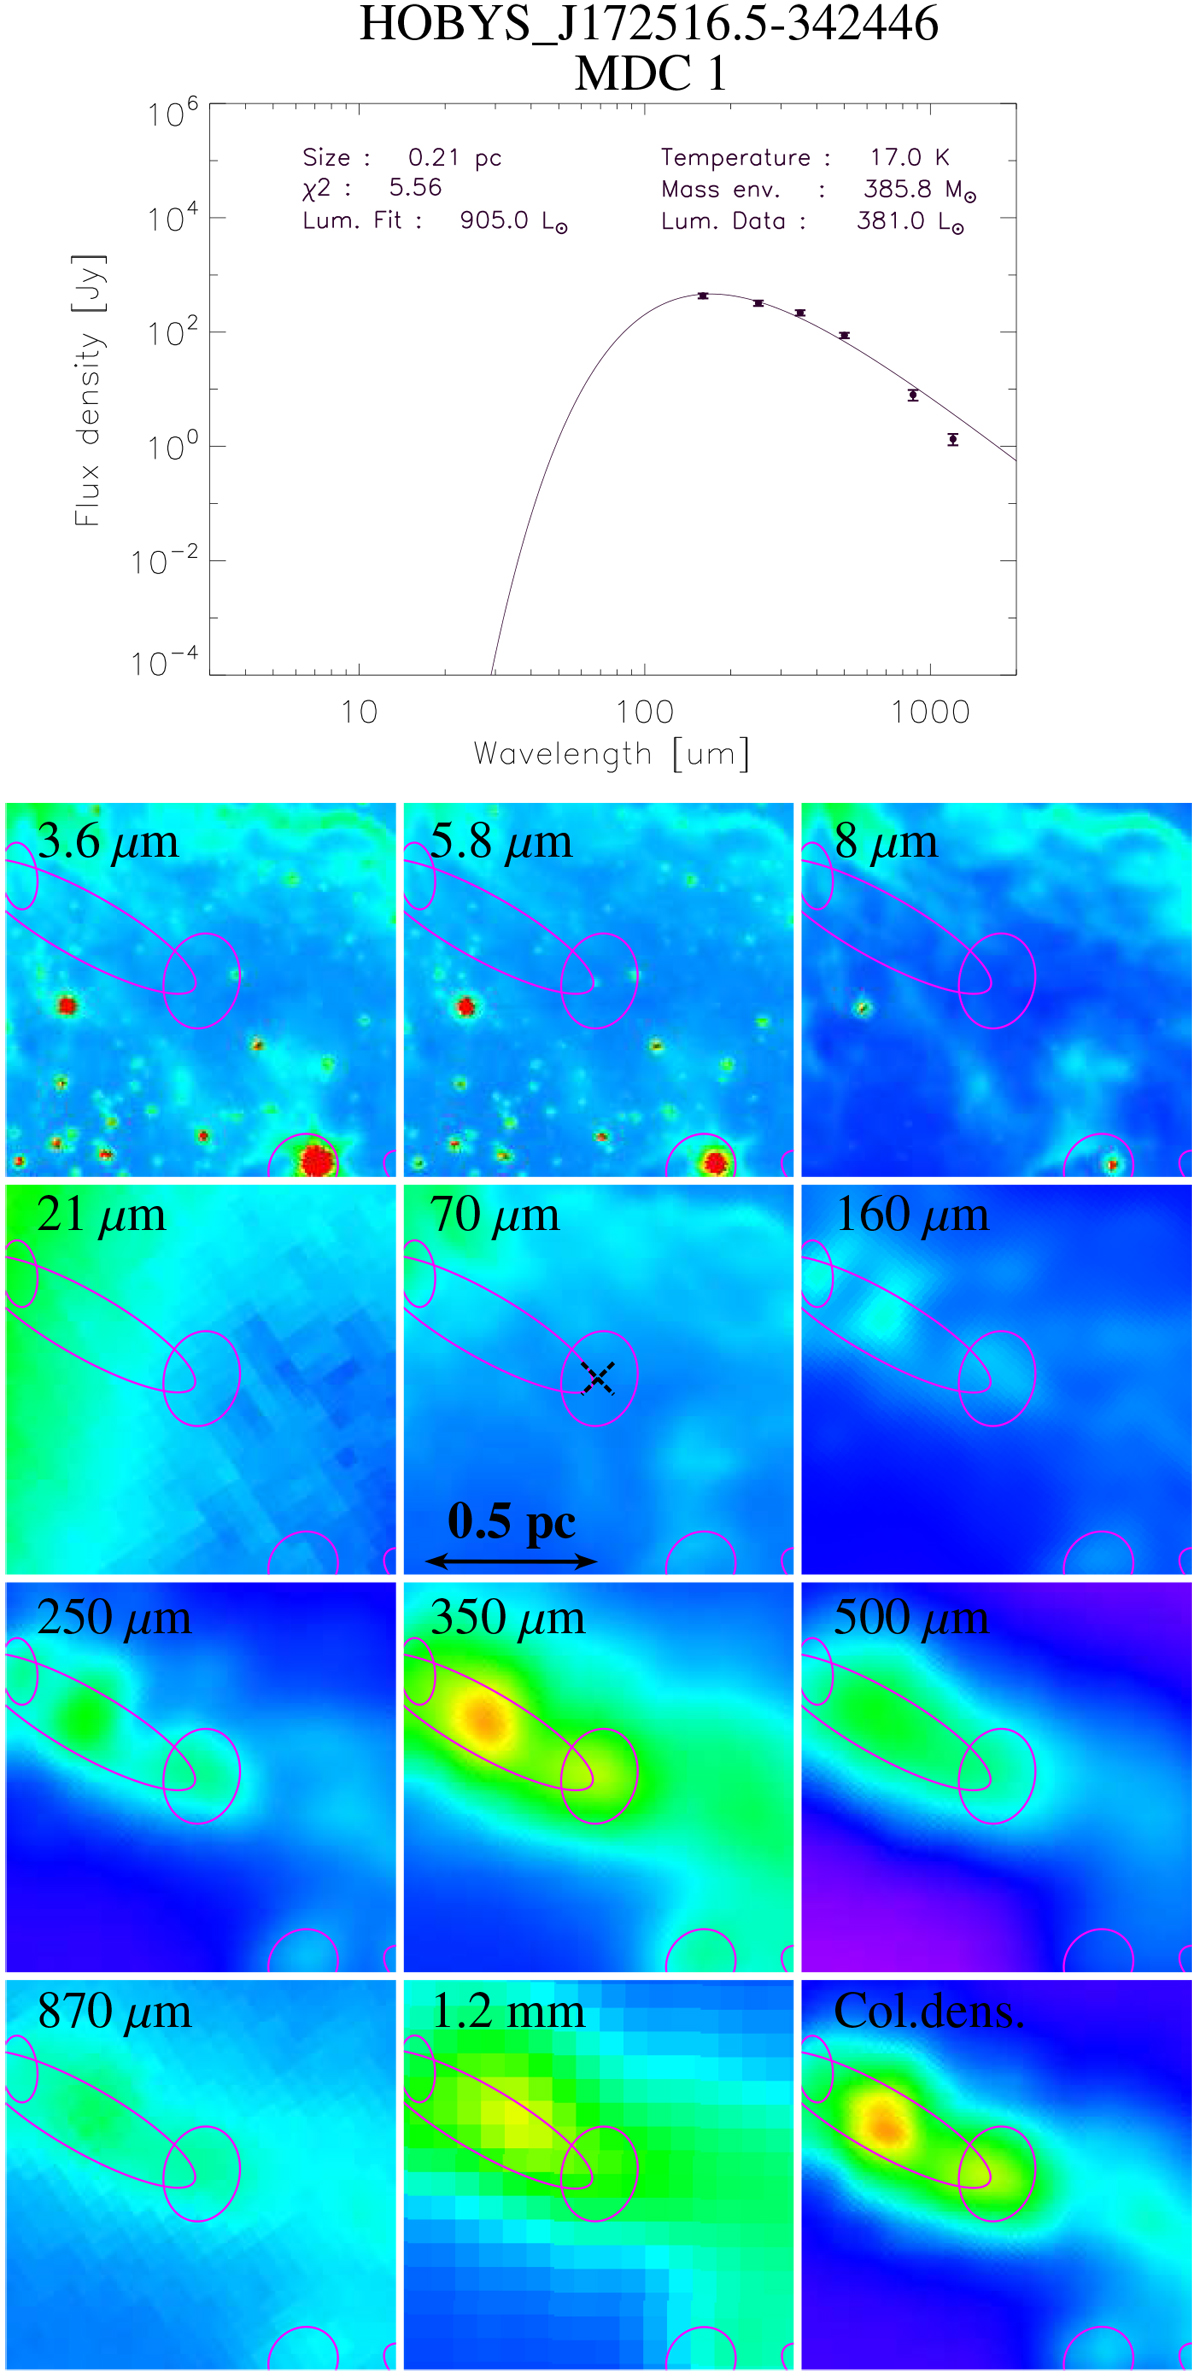
Upper panel: flux density versus wavelegnth (SED). The curve is the best fit model and the associated fitted values are indicated. Lower maps: 3.6, 5.8, 8, 21/22/24, 70, 160, 250, 350, 500, and 870 μm, 1.2 mm, and high-resolution NH2 column density maps. Ellipses represent the 160 μm getsources footprints. The MDCs is identified by a cross on the 70 μm image.“Lum.Fit” is the flux integration under the fitted curve (noted LFit in the main text) while “Lum. Data.” corresponds to the integral, using the trapezoid rule, over the finite number of data-points sampling the SED (noted LData in the main text).
Current usage metrics show cumulative count of Article Views (full-text article views including HTML views, PDF and ePub downloads, according to the available data) and Abstracts Views on Vision4Press platform.
Data correspond to usage on the plateform after 2015. The current usage metrics is available 48-96 hours after online publication and is updated daily on week days.
Initial download of the metrics may take a while.