Fig. 8
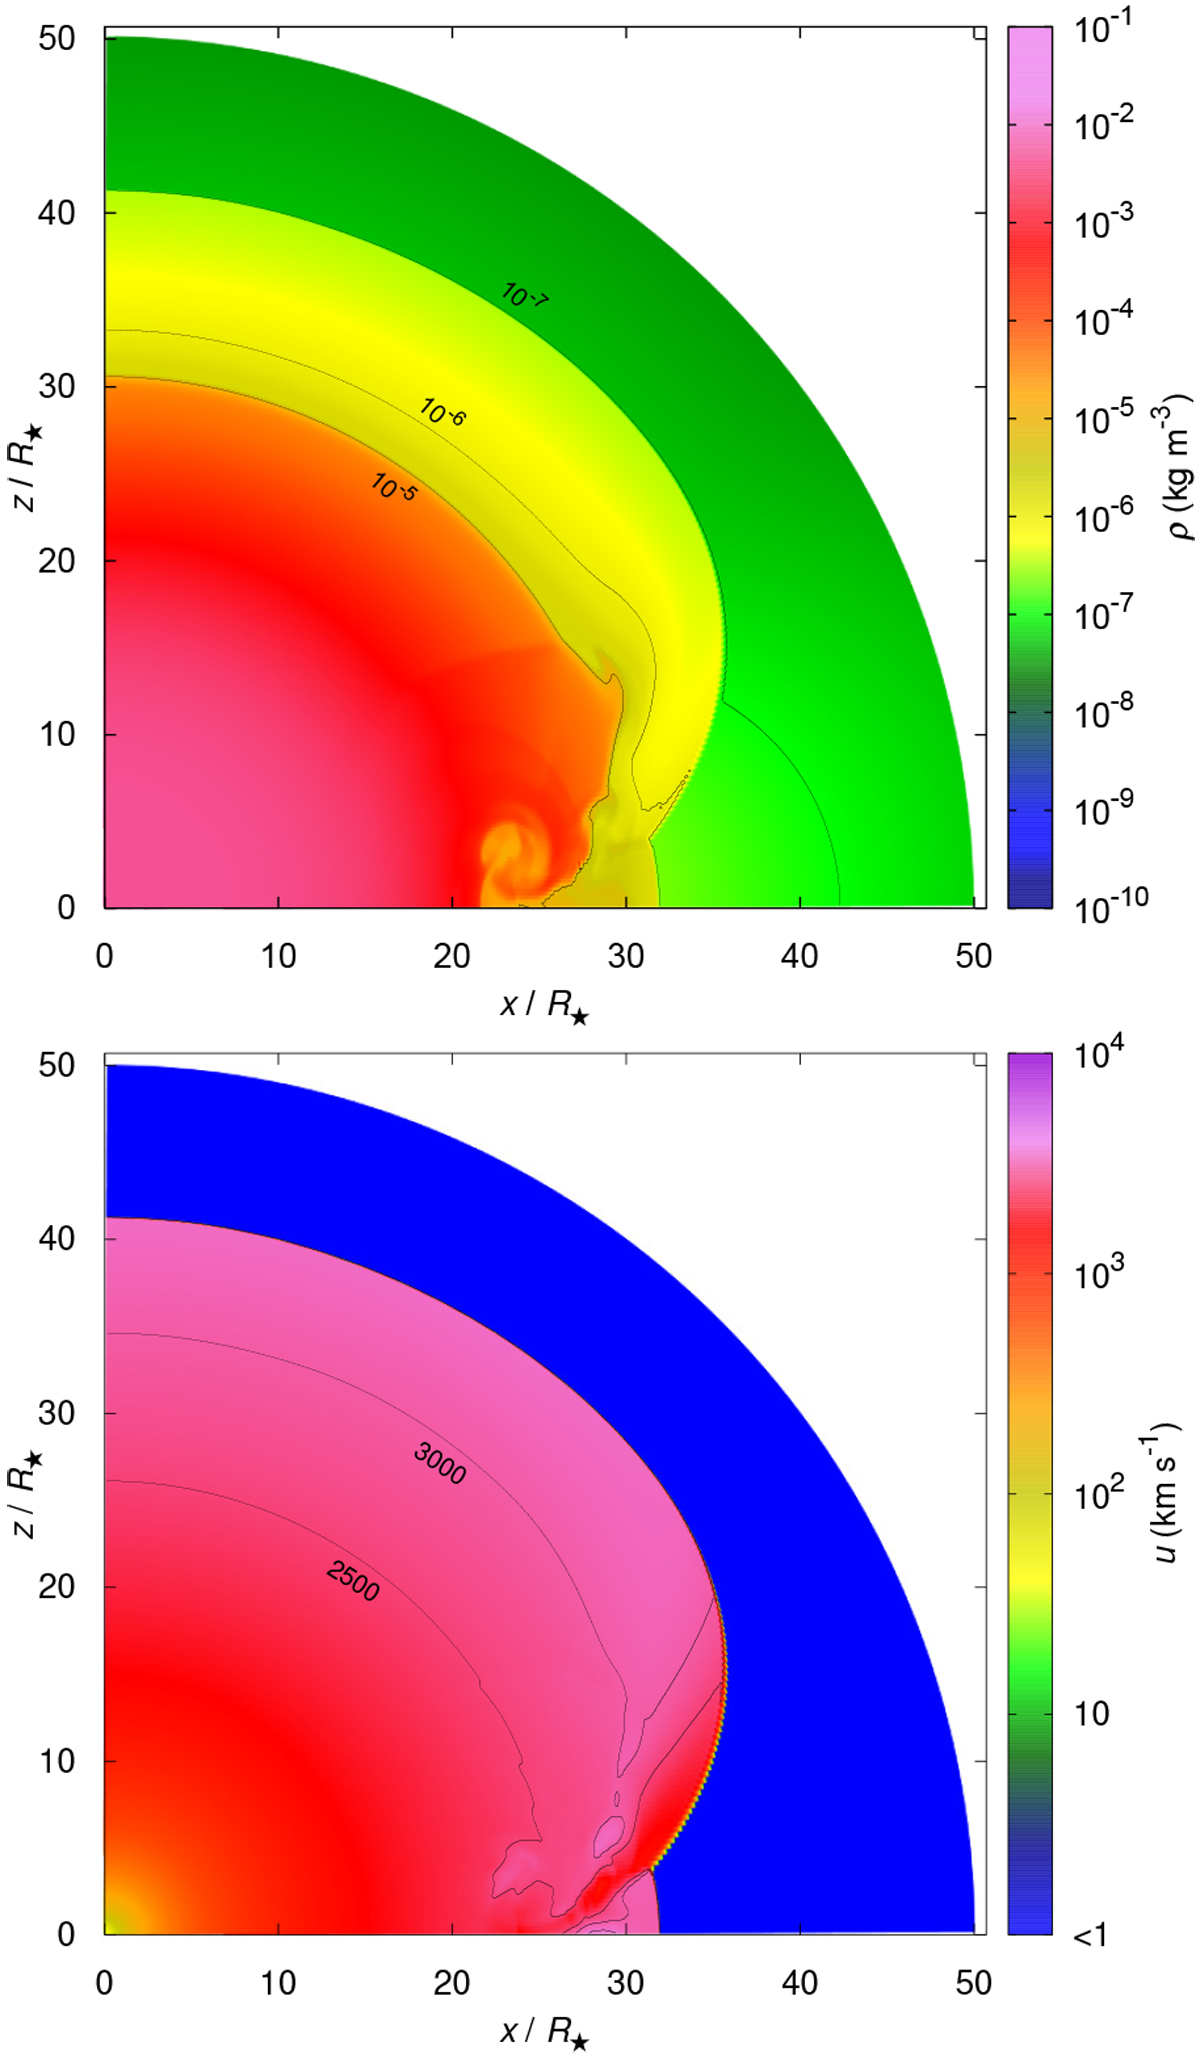
Model A: detailed color maps of the density (upper panel) and the radial velocity (lower panel) structure, up to the distance 50 R⋆ at time t ≈ 165 h since shock emergence. Contours denote the densities ρ = 10−7, 10−6, and 10−5 kg m−3 and the velocities 2500 and 3000 km s−1. The resolution of the simulation is 2400∕480 grid cells in the radial/azimuthal direction within the quadrant.
Current usage metrics show cumulative count of Article Views (full-text article views including HTML views, PDF and ePub downloads, according to the available data) and Abstracts Views on Vision4Press platform.
Data correspond to usage on the plateform after 2015. The current usage metrics is available 48-96 hours after online publication and is updated daily on week days.
Initial download of the metrics may take a while.