Fig. 6
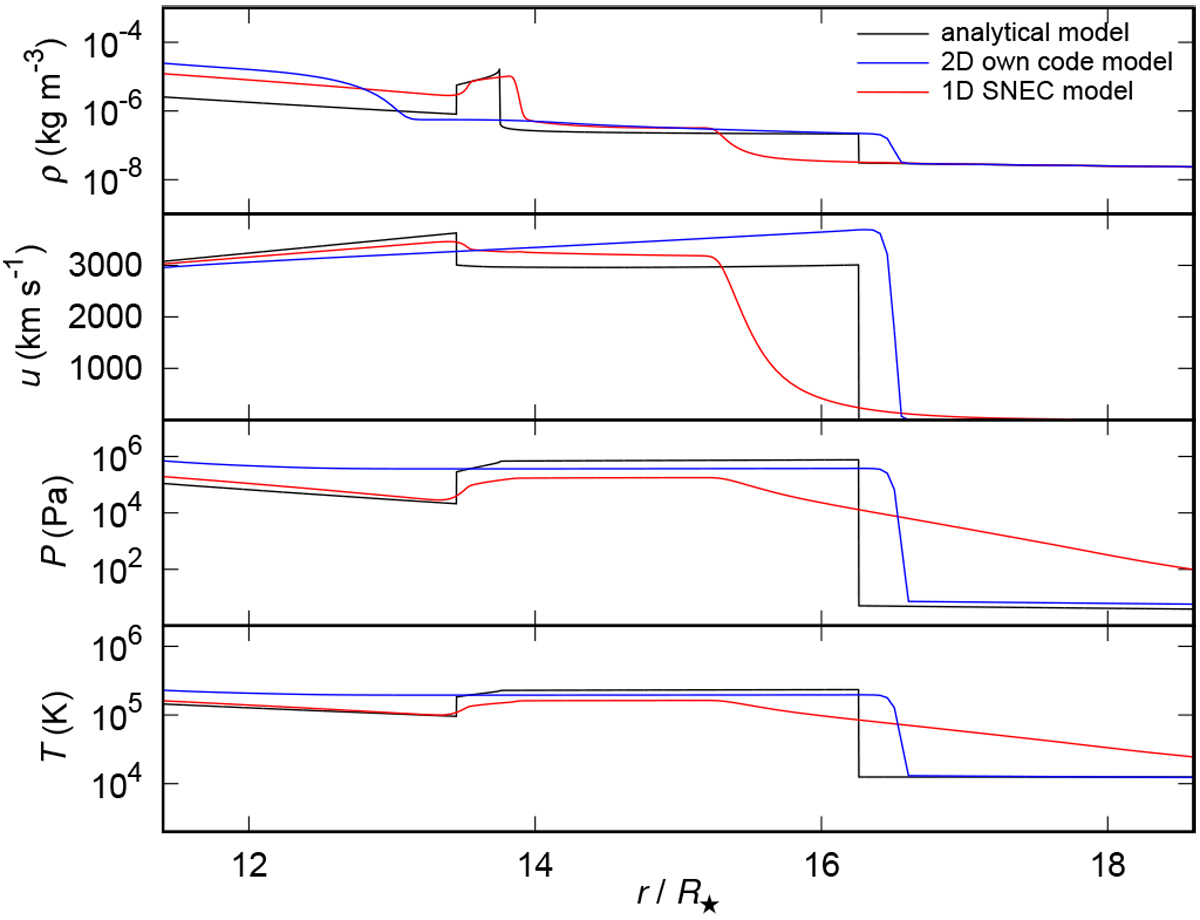
Model A: results of semi-analytical solution of the density ρ, velocity u, pressure P, and temperature T (black line), with the slope parameters n = 7 and wsw = 2, in the polar direction. The method of calculation is described in Sect. A.2. The time is the same as in Figs. 3–5. The velocity at the outer shock wave region (at approx. 16 R⋆) correspondsto the polar expansion velocity in the panel B of Fig. 4 while the other quantities and semi-analytical model input variables are described in Appendix A.2. The blue line depicts the corresponding calculation from our 2D model. The corresponding 1D profile calculated using the SNEC-1.01 code is depicted with a red line (see the description in Sect. 5.1).
Current usage metrics show cumulative count of Article Views (full-text article views including HTML views, PDF and ePub downloads, according to the available data) and Abstracts Views on Vision4Press platform.
Data correspond to usage on the plateform after 2015. The current usage metrics is available 48-96 hours after online publication and is updated daily on week days.
Initial download of the metrics may take a while.