Fig. 5
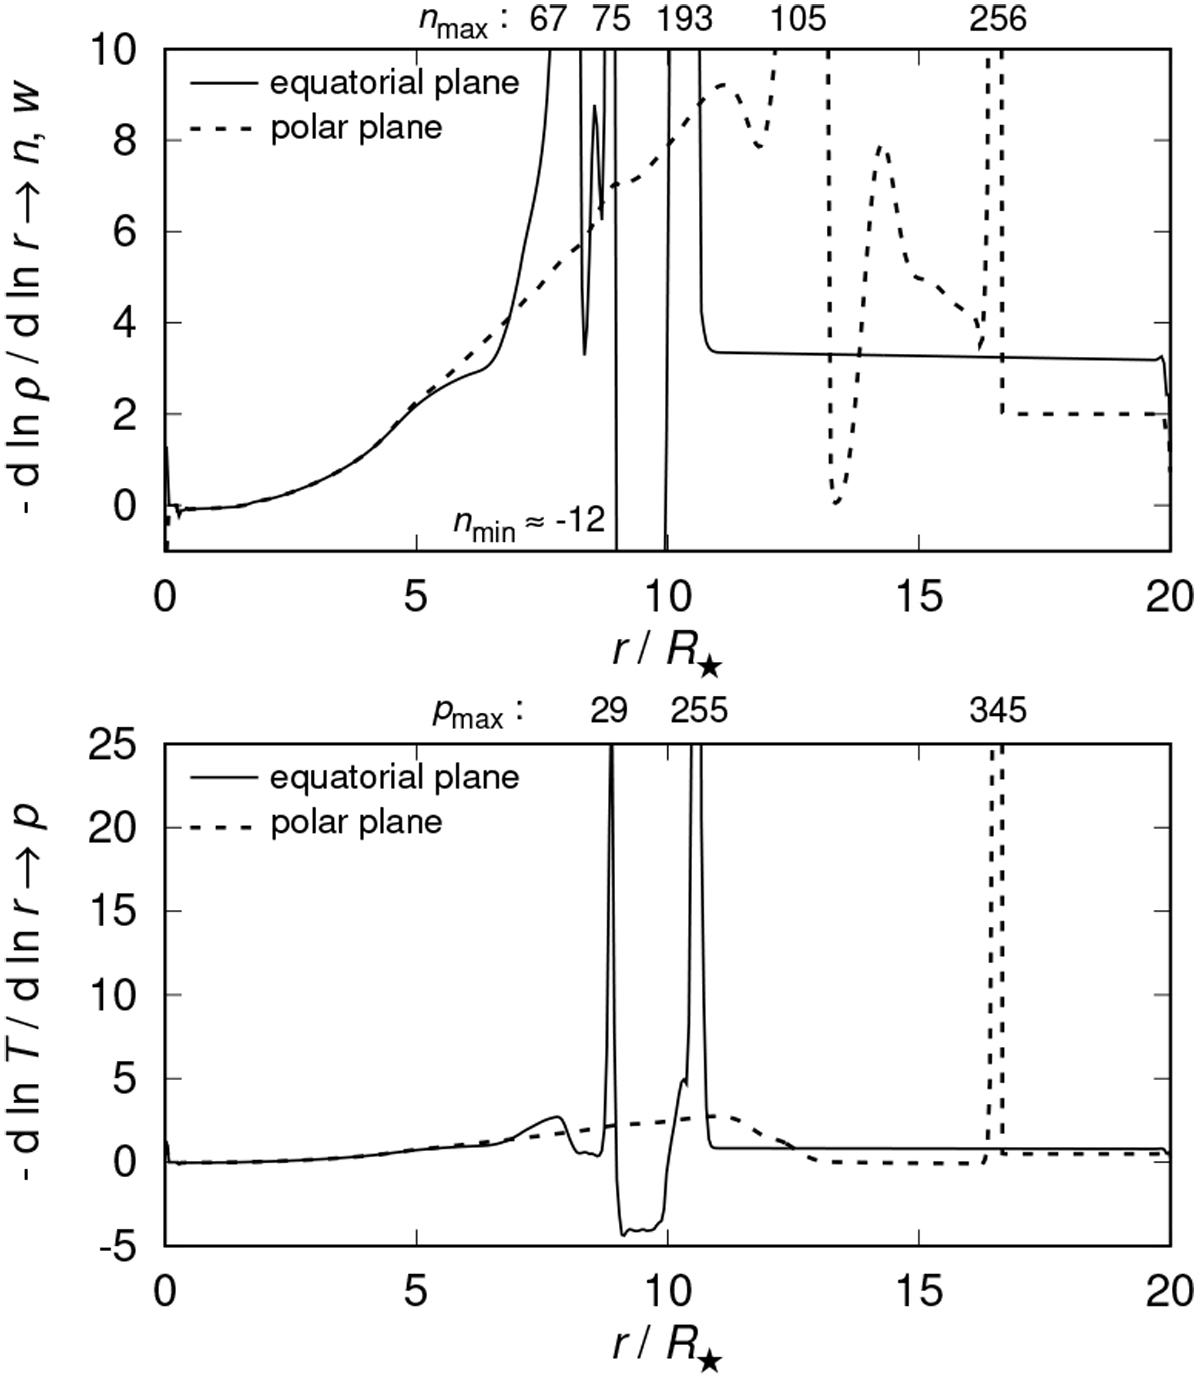
Model A: upper panel: slope parameters n and w of the density (see Eq. (17)) in the equatorial (solid line) and polar (dashed line) direction corresponding to the panel A in Fig. 4, at the same time. The position of the outer shock wave is at r ≈ 11 R⋆ in the equatorial direction, while it is at r ≈ 16.5 R⋆ in the polar direction. There are preserved the initial density slope parameters of CSM, wsw = 2 in the polar direction and wcsd = 3.5 in the equatorial direction, above these radii. The inner envelope density slope parameter increases from n = 0 to n ≈ 9 in the polar direction. The numbers nmax and nmin above and below the graph denote the maximal and minimal slopes within the peaks of the density gradient discontinuities. Lower panel: slope parameters p of the temperature (cf. Eq. (5)) in the equatorial (solid line) and polar (dashed line) direction corresponding to the temperature graph (panel C) in Fig. 4 at the same time. The inner envelope (smooth) temperature slope parameter increases to p ≈ 2.7 at r ≈ 7.8 R⋆ in the equatorial direction while it increases to approximately the same value at r ≈ 11 R⋆ in the polar direction. The slope parameter p outside the outer shock is p = 0.875 in the equatorial and p = 0.5 in the polar direction. The numbers pmax above the graph denote the maximal temperature slopes within the peaks of the T gradient discontinuities.
Current usage metrics show cumulative count of Article Views (full-text article views including HTML views, PDF and ePub downloads, according to the available data) and Abstracts Views on Vision4Press platform.
Data correspond to usage on the plateform after 2015. The current usage metrics is available 48-96 hours after online publication and is updated daily on week days.
Initial download of the metrics may take a while.