Free Access
Fig. 19
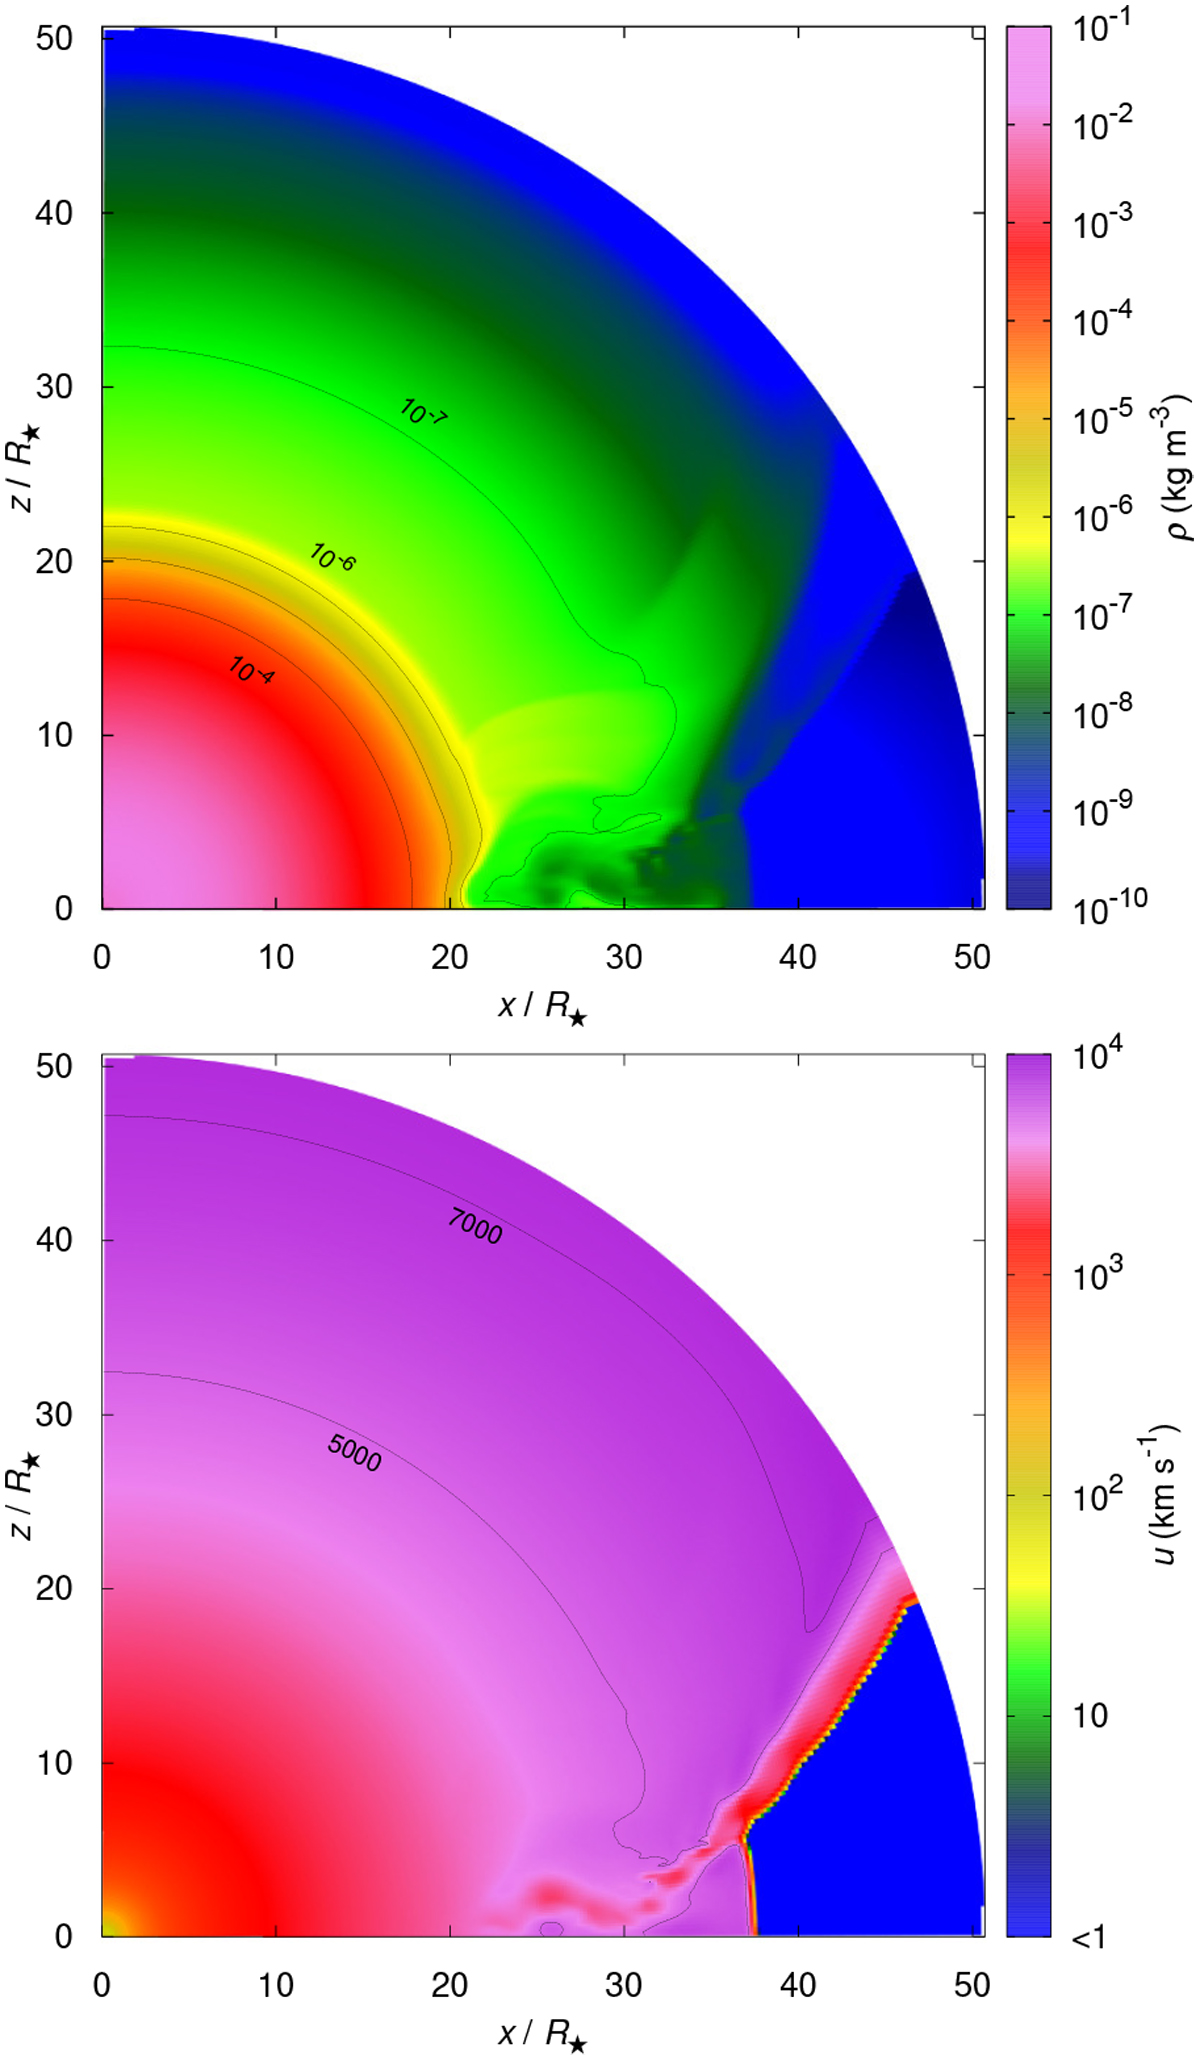
Model C: detailed color maps of the density (upper panel) and radial velocity (lower panel) up to the distance 50 R⋆ at time t ≈ 105 h since shock emergence, with the same resolution as in Fig. 8. Contours denote the densities ρ = 10−7, 10−6, 10−5, and 10−4 kg m−3 and the velocities 5000 and 7000 km s−1.
Current usage metrics show cumulative count of Article Views (full-text article views including HTML views, PDF and ePub downloads, according to the available data) and Abstracts Views on Vision4Press platform.
Data correspond to usage on the plateform after 2015. The current usage metrics is available 48-96 hours after online publication and is updated daily on week days.
Initial download of the metrics may take a while.