Fig. 15
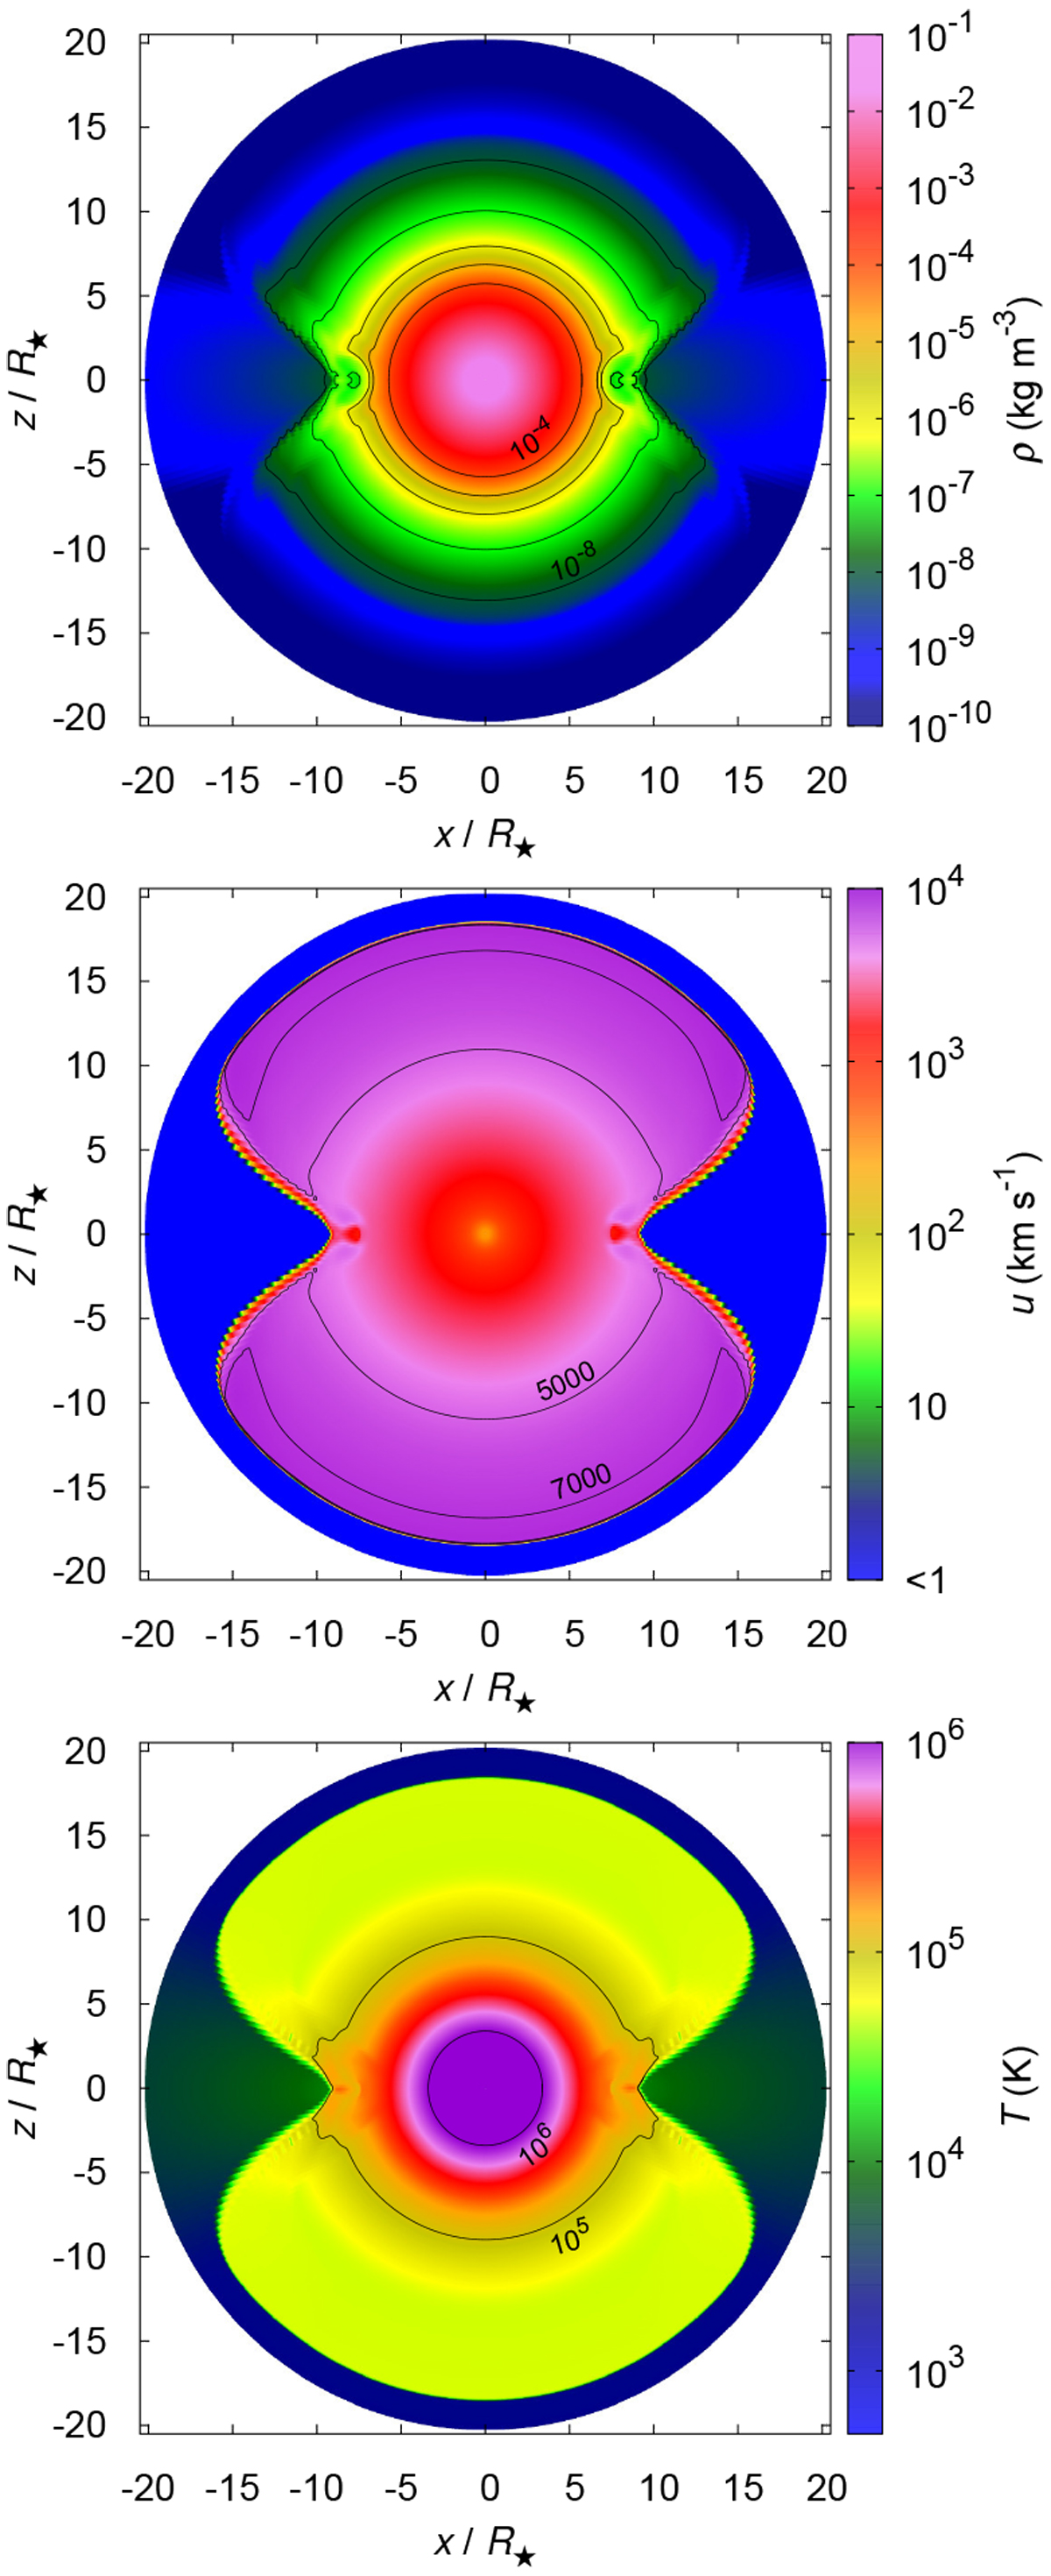
Model C: color maps of the hydrodynamical variables at time t ≈ 33 h since shock emergence. Upper panel: color map of the density structure. Contours denote the densities ρ =10−8, 10−7, 10−6, 10−5, and 10−4 kg m−3. Middle panel: color map of the velocity structure. Contours denote the velocities u = 5000 and 7000 km s−1. Lower panel: color map of the temperature structure. Contours denote the temperatures T = 105 and 106 K. Characteristic 1D sections of the model in the equatorial plane and in the polar direction are shown in Fig. 17.
Current usage metrics show cumulative count of Article Views (full-text article views including HTML views, PDF and ePub downloads, according to the available data) and Abstracts Views on Vision4Press platform.
Data correspond to usage on the plateform after 2015. The current usage metrics is available 48-96 hours after online publication and is updated daily on week days.
Initial download of the metrics may take a while.