Fig. 11
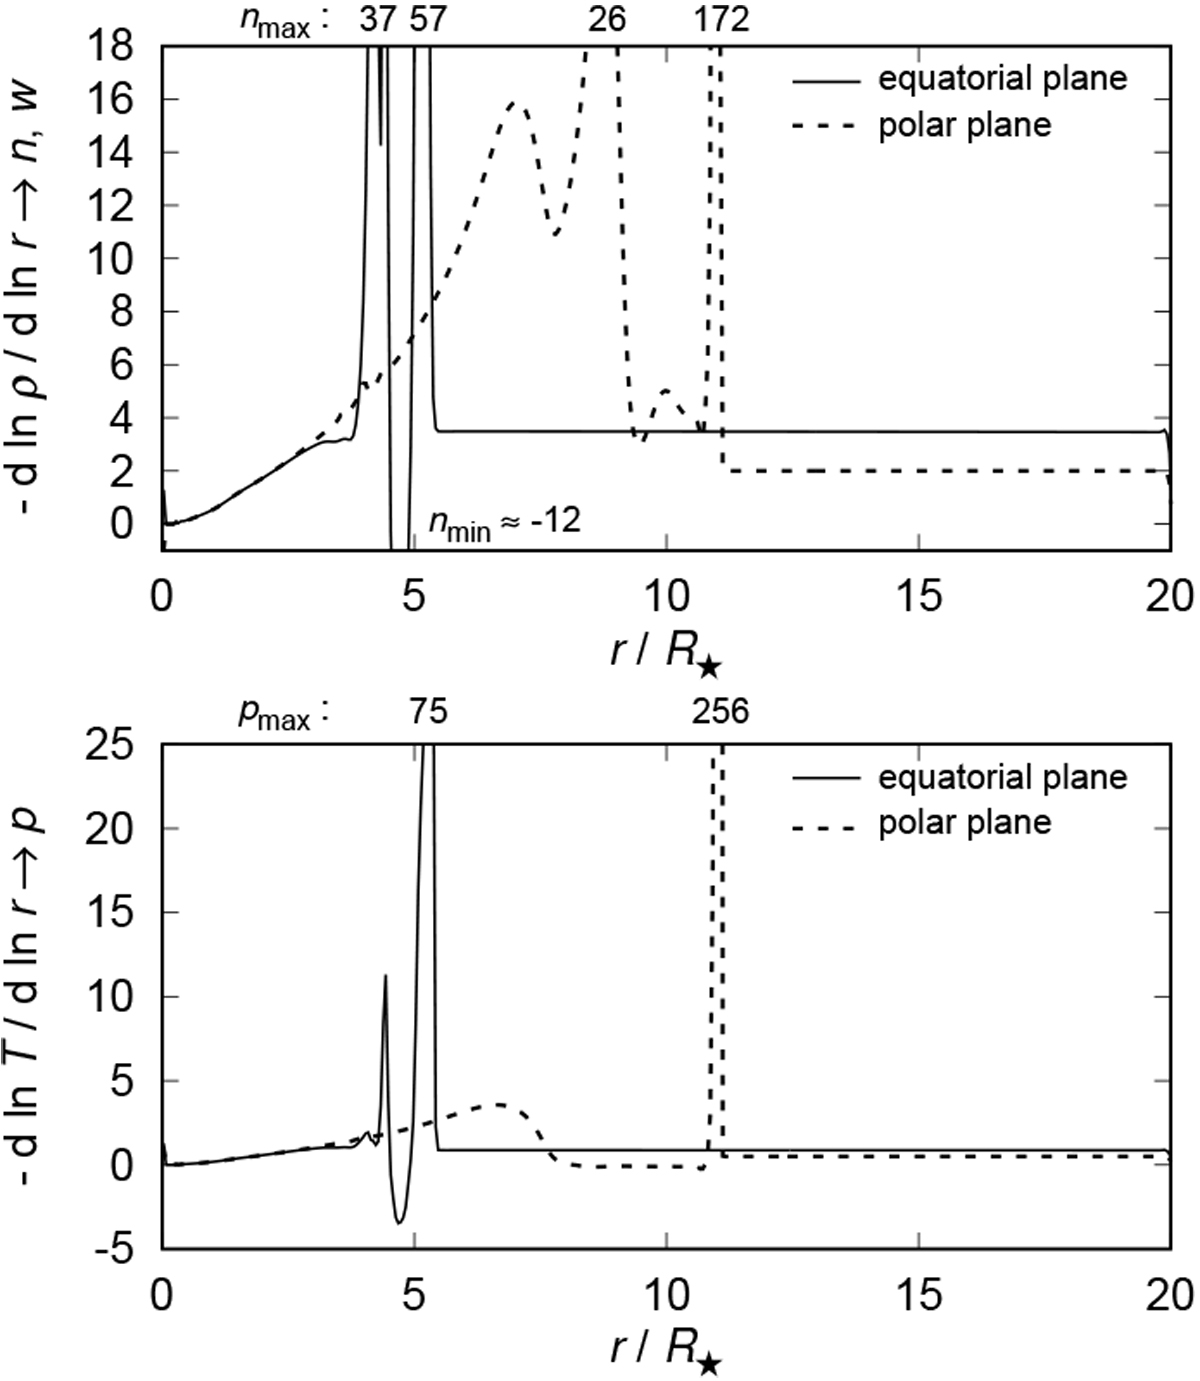
Model B: upper panel: slope parameters n and w of the density (analogous to Fig. 5) in the equatorial (solid line) and polar (dashed line) direction, corresponding to panel A in Fig. 10 at the same time t ≈ 33 h. The positionof the outer shock wave is at r ≈ 5.5 R⋆ in the equatorial direction, while it is at r ≈ 11 R⋆ in the polar direction. The inner envelope density slope parameter increases from n = 0 to n ≈ 16 in the polar direction. Lower panel: slope parameters p of thetemperature in the equatorial (solid line) and polar (dashed line) direction corresponding to the temperature graph (panel C) in Fig. 10 at the same time. The inner envelope (smooth) temperature slope parameter increases to p ≈ 1.9 at r ≈ 4.1, R⋆ in the equatorial direction while it increases to p ≈ 3.6 at r ≈ 6.6 R⋆ in the polar direction.
Current usage metrics show cumulative count of Article Views (full-text article views including HTML views, PDF and ePub downloads, according to the available data) and Abstracts Views on Vision4Press platform.
Data correspond to usage on the plateform after 2015. The current usage metrics is available 48-96 hours after online publication and is updated daily on week days.
Initial download of the metrics may take a while.