Fig. 7.
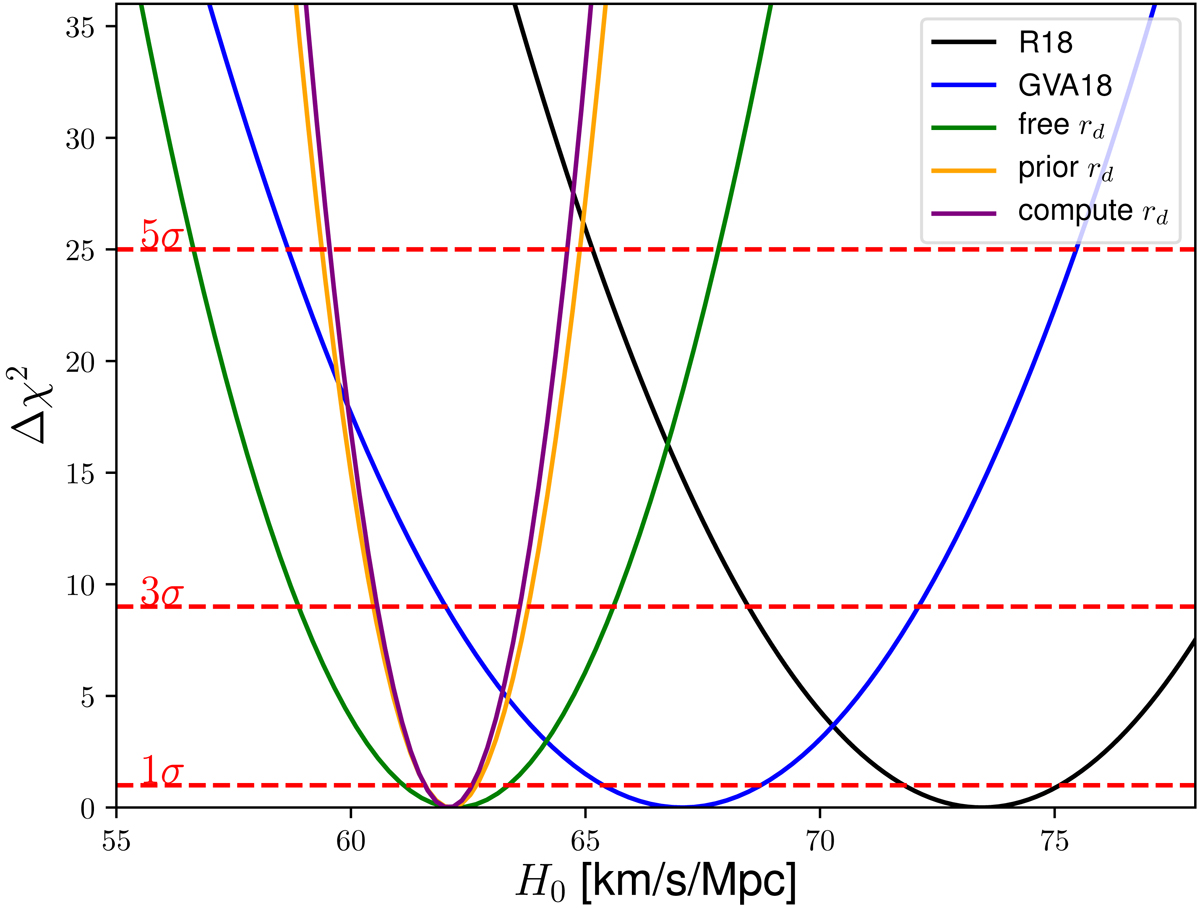
Profile likelihood (minus ![]() and assuming Gaussian likelihoods) of different values for the Hubble constant. The black line corresponds to the value measured from the HST (R18), while the blue one stands for the measured value from SNIa and H(z) data using Gaussian processes (GVA18). The other three profiles represent the predicted value from a nonaccelerated reconstruction (with SNIa intrinsic luminosity evolution) with different approaches to combine the three main data sets of this work (SNIa, BAO, and CMB): these consider rd a free parameter (green), add a prior on it (yellow), or compute it explicitly (purple), respectively. The 1σ, 3σ, and 5σ lines are represented as a reference.
and assuming Gaussian likelihoods) of different values for the Hubble constant. The black line corresponds to the value measured from the HST (R18), while the blue one stands for the measured value from SNIa and H(z) data using Gaussian processes (GVA18). The other three profiles represent the predicted value from a nonaccelerated reconstruction (with SNIa intrinsic luminosity evolution) with different approaches to combine the three main data sets of this work (SNIa, BAO, and CMB): these consider rd a free parameter (green), add a prior on it (yellow), or compute it explicitly (purple), respectively. The 1σ, 3σ, and 5σ lines are represented as a reference.
Current usage metrics show cumulative count of Article Views (full-text article views including HTML views, PDF and ePub downloads, according to the available data) and Abstracts Views on Vision4Press platform.
Data correspond to usage on the plateform after 2015. The current usage metrics is available 48-96 hours after online publication and is updated daily on week days.
Initial download of the metrics may take a while.