Fig. 4.
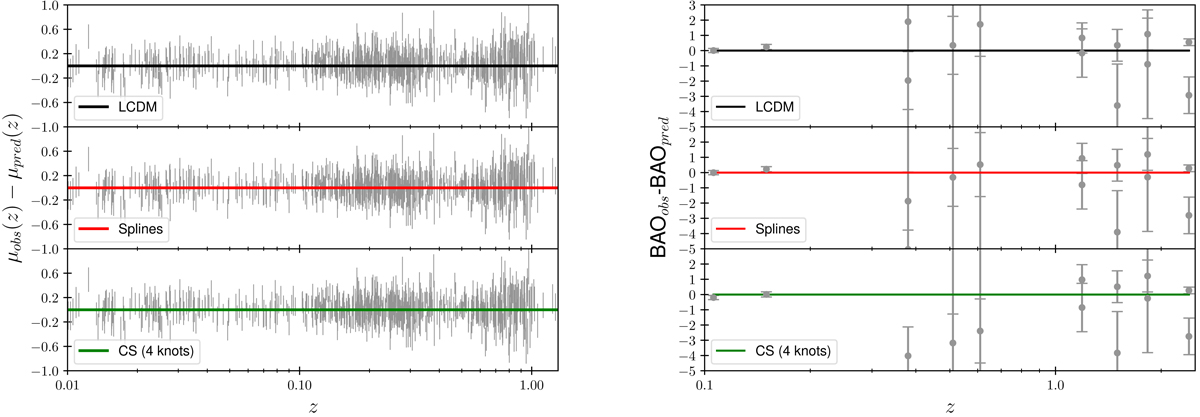
Residuals between the observations and the prediction of the different models, ΛCDM, spline reconstruction, and coasting reconstruction with SNIa intrinsic luminosity evolution, for the SNIa and BAO observables. The predictions have been computed using the best-fit values for the parameters obtained from the fit of the combination SNIa+BAO+CMB computing rd explicitly. Left plot: residuals of the SNIa distance modulus for the three different models: ΛCDM (black, top panel), spline reconstruction (red, central panel), and coasting reconstruction (green, bottom panel). The residuals have been normalized with respect to the prediction for each model. Right plot: residuals of the BAO measurements following the same color convention as in the left panel. The residuals have been normalized with respect to the prediction for each model.
Current usage metrics show cumulative count of Article Views (full-text article views including HTML views, PDF and ePub downloads, according to the available data) and Abstracts Views on Vision4Press platform.
Data correspond to usage on the plateform after 2015. The current usage metrics is available 48-96 hours after online publication and is updated daily on week days.
Initial download of the metrics may take a while.