Fig. 3.
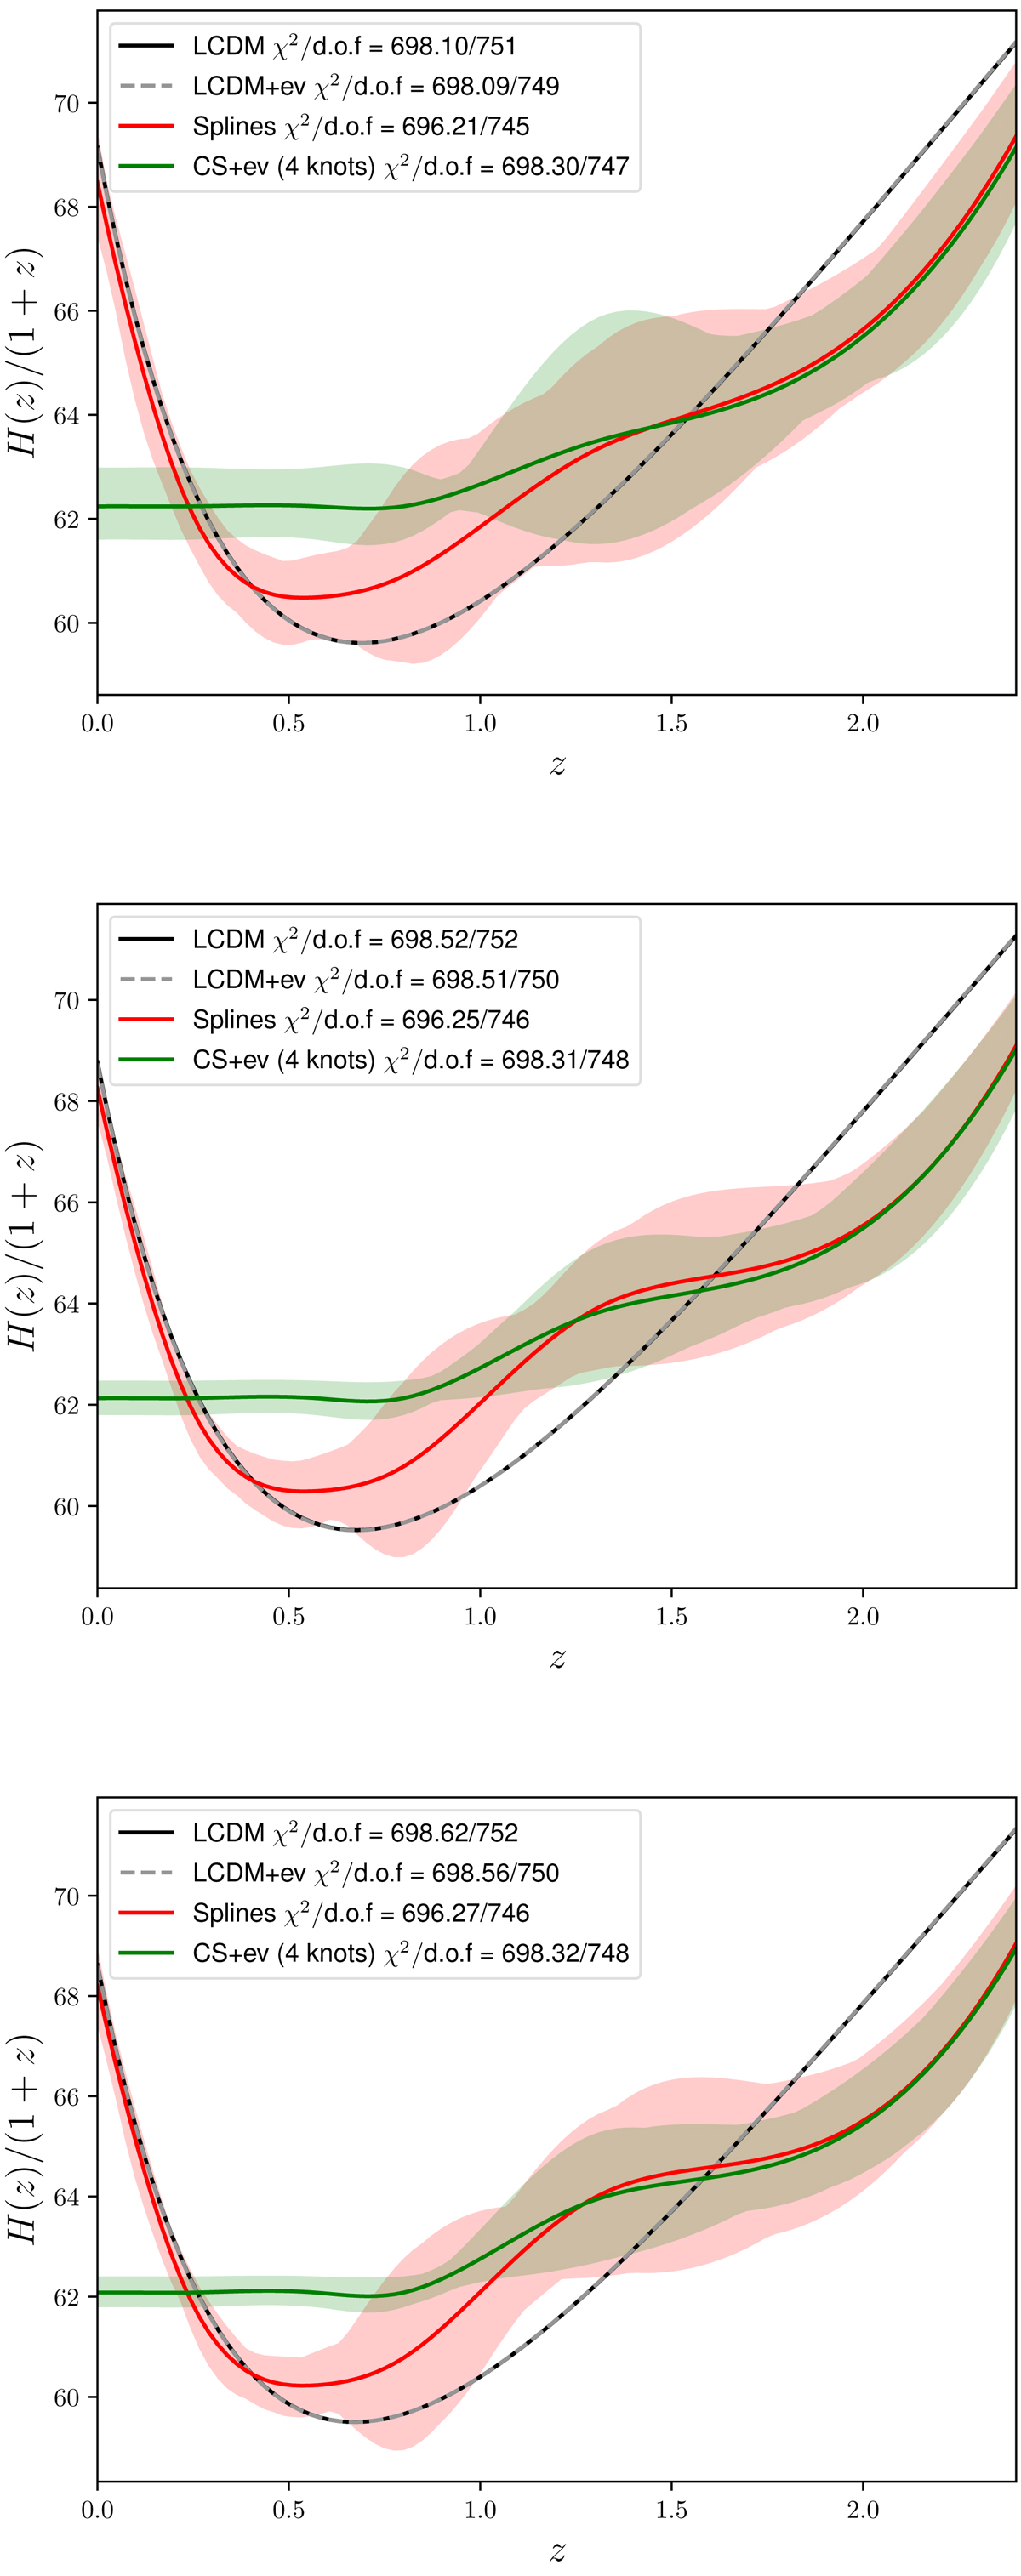
Reconstruction of the expansion rate, H(z)/(1 + z), as a function of the redshift using the combination of SNIa, BAO, and CMB data. In the top panel the data sets have been combined considering rd a free parameter, while in the central panel a prior on rd has been used, and it has been explicitly computed in the bottom panel. In all panels the black and gray lines represent the ΛCDM model (without and with SNIa luminosity evolution, respectively), while the red band shows the reconstruction with Δχ2 ≤ 1 with respect to the best reconstruction (red line). The green band stands for the reconstruction of a coasting universe at low redshift when SNIa intrinsic luminosity is allowed to vary as a function of redshift. See the text for the details of the reconstruction.
Current usage metrics show cumulative count of Article Views (full-text article views including HTML views, PDF and ePub downloads, according to the available data) and Abstracts Views on Vision4Press platform.
Data correspond to usage on the plateform after 2015. The current usage metrics is available 48-96 hours after online publication and is updated daily on week days.
Initial download of the metrics may take a while.