Free Access
Fig. 4.
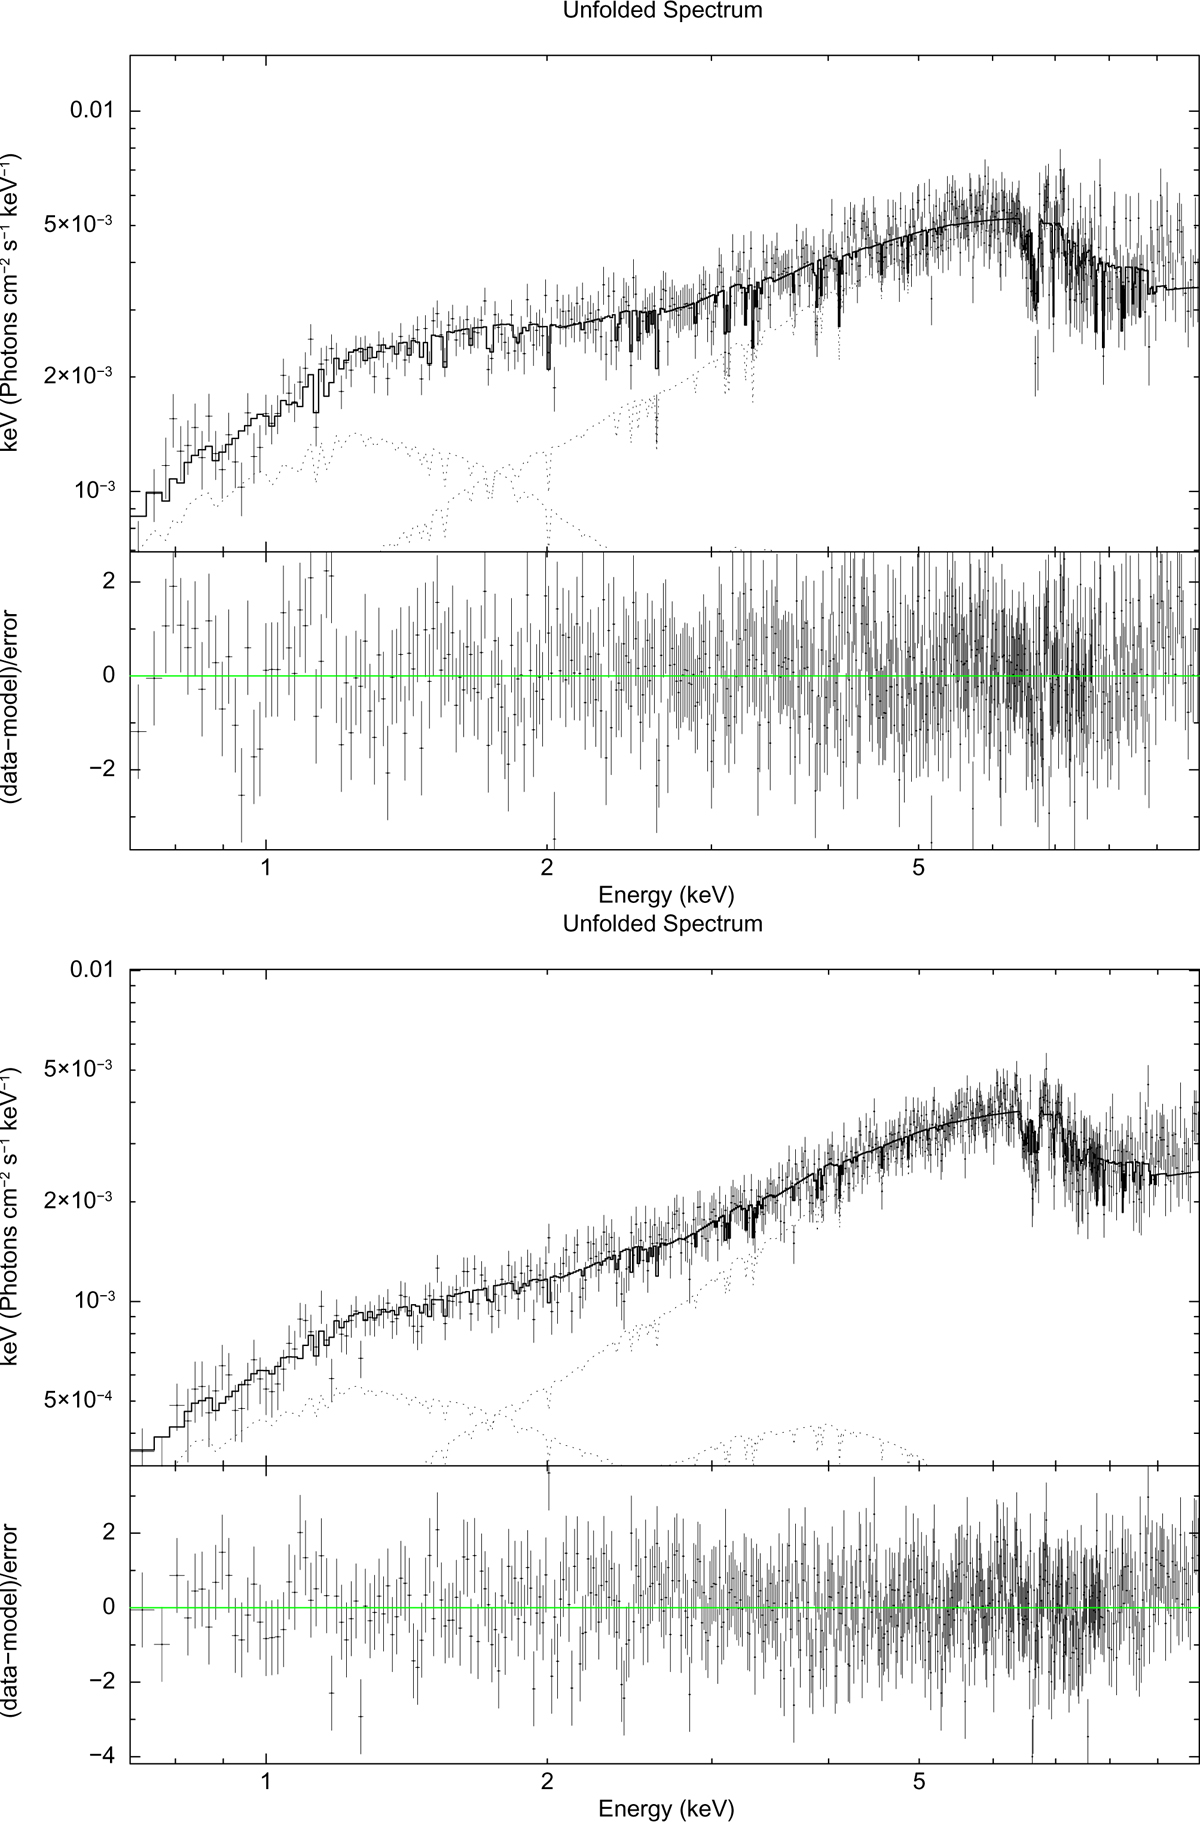
Best-fit model for the dip spectra obtained from the Suzaku/XIS03 data of ObsID 409032010 (Obs2, upper plot) and ObsID 409032010 (Obs3, bottom plot). The residuals with respect to the adopted model are shown in units of sigma in the bottom panel of each plot.
Current usage metrics show cumulative count of Article Views (full-text article views including HTML views, PDF and ePub downloads, according to the available data) and Abstracts Views on Vision4Press platform.
Data correspond to usage on the plateform after 2015. The current usage metrics is available 48-96 hours after online publication and is updated daily on week days.
Initial download of the metrics may take a while.