Fig. 3.
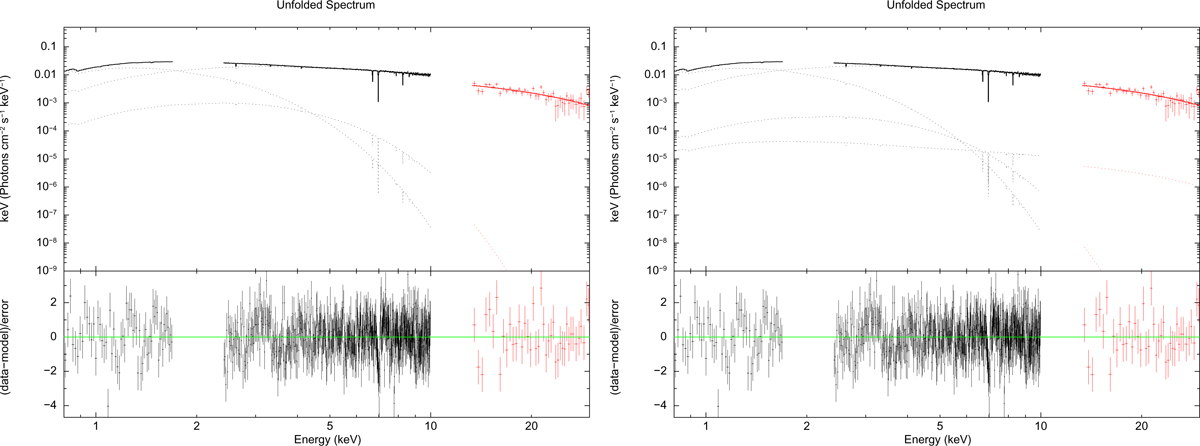
Best-fit models performed on data of ObsID 409032010 + 409032020 (Spectrum 2) taking into account the contribution of a local absorber. Left: warm_1seed model. Right: warm_2seed model. In each plot the black data represent the combined XIS03 spectra of the two observations, whilst the red data represent the combined PIN spectra of the two observations. The bottom panel of each plot represents the residuals in units of sigma with respect to the adopted model.
Current usage metrics show cumulative count of Article Views (full-text article views including HTML views, PDF and ePub downloads, according to the available data) and Abstracts Views on Vision4Press platform.
Data correspond to usage on the plateform after 2015. The current usage metrics is available 48-96 hours after online publication and is updated daily on week days.
Initial download of the metrics may take a while.